# Pivot Table Timeline Slicer
## Content
Timeline slicers are interactive filters that allow you to filter data quickly by date, month, year, and quarter. A visual interface is provided with controllers to help you zoom in and out on any period to view and filter the pivot data.
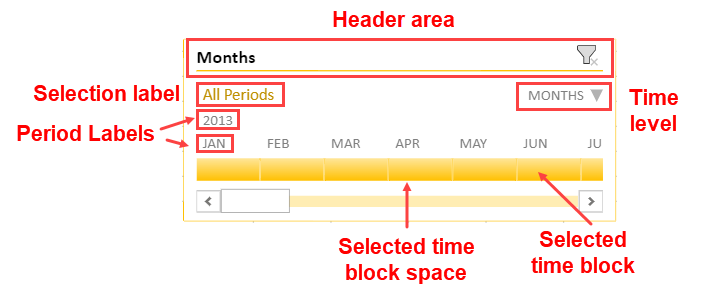
The timeline slicer only works on date fields of a pivot table using a label condition filter. It can be added to a pivot table using the [Slicers.add](/spreadjs/api/v16/classes/GC.Spread.Sheets.Slicers.SlicerCollection#add) class method. Set *PivotTimeline* as the slicer type and apply [TimelineLevel](/spreadjs/api/v16/enums/GC.Spread.Sheets.Slicers.TimelineLevel) enumeration options such as years, quarters, months, and dates to specify how to filter the data in a slicer.
The [PivotTableTimelineSlicer](/spreadjs/api/v16/classes/GC.Spread.Pivot.PivotTableTimelineSlicer) class provides various methods to customize the slicer UI.
### Use Case Scenario
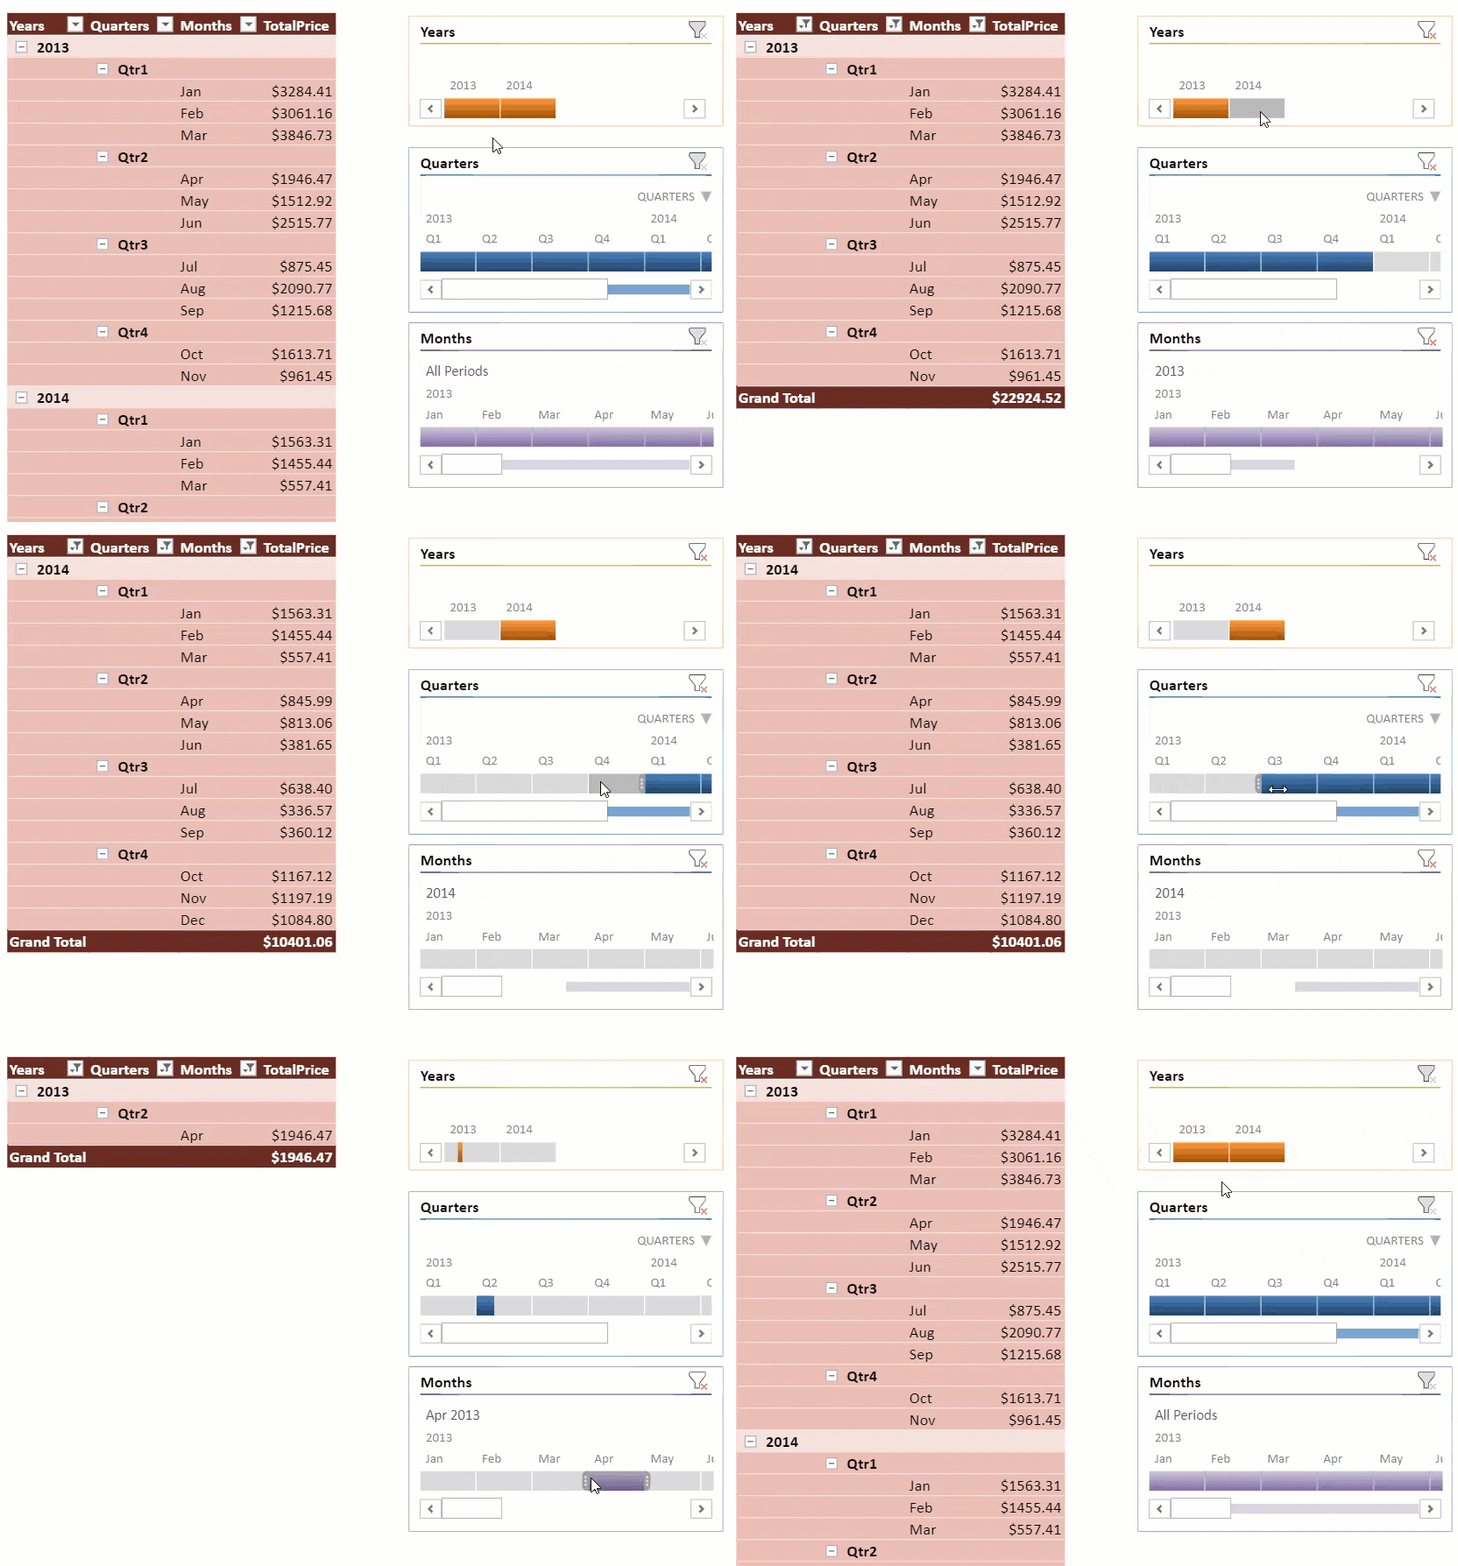
Consider the example where the food sales company selling food and beverage products wants to display the sales data of products across various quarters of a year.
The timeline slicer can help in analyzing the data based on the period as illustrated in the GIF below.
```javascript
// Add timeline slicers for year, quarter, month filters
var timeline_year = sheet.slicers.add("timeline_year", pt.name(), "OrderDate", GC.Spread.Sheets.Slicers.TimelineStyles.dark6(), GC.Spread.Sheets.Slicers.SlicerType.pivotTimeline);
timeline_year.position(new GC.Spread.Sheets.Point(600, 10));
timeline_year.level(GC.Spread.Sheets.Slicers.TimelineLevel.years);
timeline_year.showSelectionLabel(false);
timeline_year.showTimeLevel(false);
timeline_year.showHorizontalScrollbar(false);
timeline_year.height(100);
timeline_year.captionName("Years");
var timeline_quarter = sheet.slicers.add("timeline_quarter", pt.name(), "OrderDate", GC.Spread.Sheets.Slicers.TimelineStyles.dark1(), GC.Spread.Sheets.Slicers.SlicerType.pivotTimeline);
timeline_quarter.position(new GC.Spread.Sheets.Point(600, 130));
timeline_quarter.level(GC.Spread.Sheets.Slicers.TimelineLevel.quarters);
timeline_quarter.captionName("Quarters");
timeline_quarter.showSelectionLabel(false);
var timeline_month = sheet.slicers.add("timeline_month", pt.name(), "OrderDate", GC.Spread.Sheets.Slicers.TimelineStyles.light4(), GC.Spread.Sheets.Slicers.SlicerType.pivotTimeline);
timeline_month.position(new GC.Spread.Sheets.Point(600, 290));
timeline_month.captionName("Months");
timeline_month.showTimeLevel(false);
```
## Select Slicer Items Using Designer
In the SpreadJS Designer, the following actions can be performed to select pivot table slicer items:
* Actions: Click/Drag
* Modes: Single/Multi
* Additional keys: Ctrl/Shift/None
| Parameter (Action + Mode + Key) | Case |
| ------------------------------- | ---- |
| click + single + none | Selects the clicked item. |
| click + single + ctrl
click + multi + none
click + multi + ctrl | Switches the clicked item's selection status. |
| click + single + shift | Sets the selection range from start point to click item index. Items in the range remain selected, others remain unselected. |
| click + multi + shift
drag + multi + shift | Sets the selection range from start point to click item index, and sets selection status to true. (Never False) |
| drag + single + none | Sets the dragged items status to true, others to false. |
| drag + single + ctrl
drag + multi + none
drag + multi + ctrl | Switches the dragged item's selection status. |
| drag + single + shift | Sets the selection range from start point to drag end item index.
Items in the range are selected. |