# Gauge KPI Sparkline
## Content
SpreadJS provides a Gauge KPI sparkline which can be used to visualize the performance of metrics concerning KPI values. It can be used to indicate the effectiveness of management work or present sales targets etc.
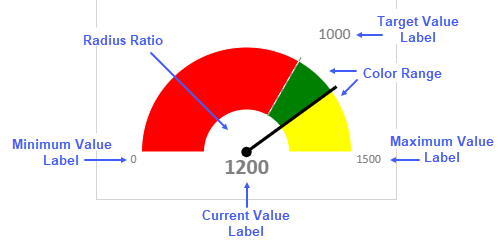
Gauge KPI sparkline uses the following values to display metrics:
* Target Value: Indicates the expected value and displays it at the bottom.
* Current Value: Indicates the current value.
* Minimum Value: Indicates the smallest expected value. It should be lower than the target value and current value.
* Maximum Value: Indicates the biggest expected value. It should be higher than the target value and current value.
## Types of Gauge KPI Sparklines
SpreadJS provides three types of Gauge KPI sparklines, namely, Circle, Vertical, and Horizontal which can be set by using the **`gaugeType`** option in the GaugeKPISparkline function.
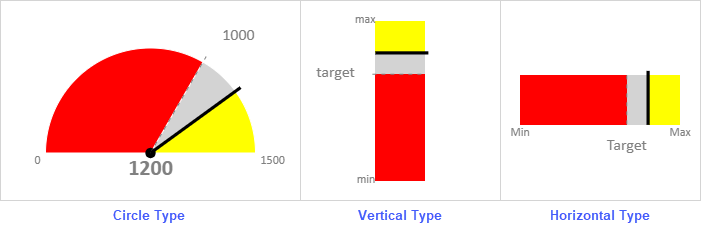
Gauge KPI sparkline formula has the following options:
| Argument | Type | Description |
| -------- | ---- | ----------- |
| **targetValue**
Required | Number | The target value of the gauge KPI sparkline. The target value is between minValue and maxValue. |
| **currentValue**
Required | Number | The current value of the gauge KPI sparkline. The current value is between minValue and maxValue. |
| **minValue**
Required | Number | The minimum value of the gauge KPI sparkline. The minValue is less than maxValue. |
| **maxValue**
Required | Number | The maximum value of the gauge KPI sparkline. The maxValue is more than minValue. |
| **showLabel**
Optional | Boolean | Specifies whether to show the label of all the values provided in the sparkline.
If false, it will not show labels.
If true, it will only show the labels which fit inside the cell width and height. The cell should have enough width and height to show both graphs and labels.
The default value is true. |
| **targetValueLabel**
Optional | String | The string to display as the target value label.
The default value is targetValue. |
| **currentValueLabel**
Optional | String | The string to display as the current value label.
The default value is currentValue. |
| **mintValueLabel**
Optional | String | The string to display as a minimum value label.
The default value is minValue. |
| **maxValueLabel**
Optional | String | The string to display as a maximum value label.
The default value is maxValue. |
| **fontArray**
Optional | CalcArray | The array contains font format as string items for the four label types -- Target value label: Default value "16px Calibri"
- Current value label: Default value "bold 22px Calibri"
- Minimum and Maximum value labels: Default value "12px Calibri"
**showLabel** option must be true. |
| **minAngle**
Optional | Number | The minimum angle value of circle type. The minAnigle should be less than maxAngle.
The angle values correspond to the time in the clock. 0 is 12 o'clock, -90 is 9 o'clock, 90 is 3 o'clock, and -180/180 is 6 o'clock.
The default value is -90.
**gaugeType** option must be 0 (circle type). |
| **maxAngle**
Optional | Number | The maximum angle value of circle type. The maxAngle should be bigger than minAngle.
The angle values correspond to the time in the clock. 0 is 12 o'clock, -90 is 9 o'clock, 90 is 3 o'clock, and -180/180 is 6 o'clock.
The default value is 90.
**gaugeType** option must be 0 (circle type). |
| **radiusRatio**
Optional | Number | The value is calculated as the ratio of the inner circle radius and outer circle radius. The outer circle radius value is decided by the cell size.
The value ranges between 0 and 1. Default is 0.
**gaugeType** option must be 0 (circle type). |
| **gaugeType**
Optional | Number | The KPI sparkline type.
0 - Circle
1 - Vertical Bar
2 - Horizontal Bar
The default type is a circle. |
| **colorRange**
Optional
Repeatable | CalcArray | The color range between specified values.
*{startValue, endValue, color\_string}*
Where *startValue* is the starting value in a range, *endValue* is the ending value in a range, and the *color\_string* is the color of the range between the two specified values.
The *startValue* must be less than the *endValue* and both the values should be between minValue and maxValue.
The default color range from minValue to maxValue is filled with light gray color. |
The Gauge KPI sparkline formula has the following syntax:
`=GAUGEKPISPARKLINE (targetValue, currentValue, minValue, maxValue,showLabel?,targetValueLabel?,currentValueLabel?,minValueLabel?,maxValueLabel?, fontArray?, minAngle?, maxAngle?, radiusRatio?, gaugeType?, colorRange?)`
## Usage Scenario
Gauge KPI sparklines are used to monitor the annual sales performance of a company. The Revenue, Profit, and Sales metrics are measured against their target and actual values which helps to visualize the data easily and make meaningful deductions.
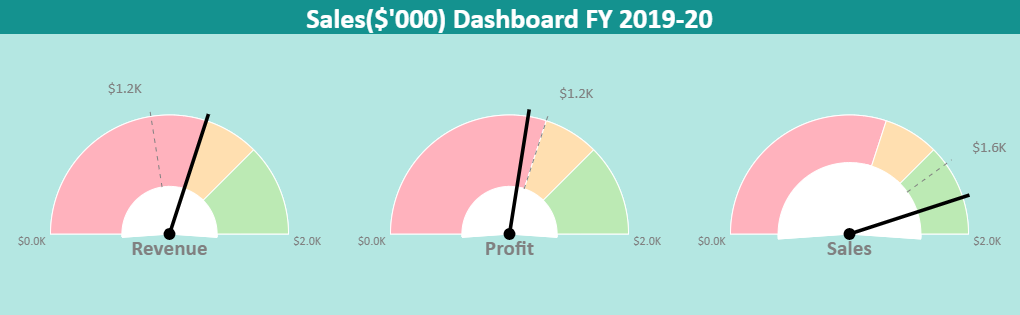
```javascript
// initializing Spread
var spread = new GC.Spread.Sheets.Workbook(document.getElementById('ss'), { sheetCount: 2 });
// get the sheets
var sheet1 = spread.sheets[0];
var sheet2 = spread.sheets[1];
// Hide gridlines
sheet1.options.gridline = { showVerticalGridline: false, showHorizontalGridline: false };
// Hide row/ col headers
sheet1.options.colHeaderVisible = false;
sheet1.options.rowHeaderVisible = false;
// set column width
for (var i = 0; i < 3; i++)
sheet1.setColumnWidth(i, 340);
for (var i = 0; i < 4; i++)
sheet2.setColumnWidth(i, 70);
for (var i = 0; i < 5; i++)
sheet2.setColumnWidth(i, 170);
// set row height
sheet1.setRowHeight(0, 35, GC.Spread.Sheets.SheetArea.dataArea);
sheet1.setRowHeight(1, 280, GC.Spread.Sheets.SheetArea.dataArea);
// set data
sheet1.setValue(0, 0, "Sales($'000) Dashboard FY 2019-20", GC.Spread.Sheets.SheetArea.dataArea);
var dataArray1 =
[
["Parameters", "Target", "Current", "Min", "Max"],
["Revenue", 900, 1200, 0, 2000],
["Profit", 1200, 1100, 0, 2000],
["Sales", 1600, 1800, 0, 2000]
];
sheet2.setArray(0, 0, dataArray1);
// set GaugeKPISparkline formula
sheet1.setFormula(1, 0, '=GAUGEKPISPARKLINE(Sheet2!B2,Sheet2!C2,Sheet2!D2,Sheet2!E2,TRUE,TEXT(Sheet2!B3/1000,"$0.0K"),Sheet2!A2,TEXT(Sheet2!D2/1000,"$0.0K"),TEXT(Sheet2!E2/1000,"$0.0K"),{"normal normal 11pt Calibri","normal bold 16pt Calibri","normal normal 9pt Calibri","normal normal 9pt Calibri"},-90,90,0.4,0,{0,1200,"#FFB2BD"},{1200,1500,"#FFDFB0"},{1500,2000,"#BCEAB4"})');
sheet1.setFormula(1, 1, '=GAUGEKPISPARKLINE(Sheet2!B3,Sheet2!C3,Sheet2!D3,Sheet2!E3,TRUE,TEXT(Sheet2!B3/1000,"$0.0K"),Sheet2!A3,TEXT(Sheet2!D3/1000,"$0.0K"),TEXT(Sheet2!E3/1000,"$0.0K"),{"normal normal 11pt Calibri","normal bold 16pt Calibri","normal normal 9pt Calibri","normal normal 9pt Calibri"},-90,90,0.4,0,{0,1200,"#FFB2BD"},{1200,1500,"#FFDFB0"},{1500,2000,"#BCEAB4"})');
sheet1.setFormula(1, 2, '=GAUGEKPISPARKLINE(Sheet2!B4,Sheet2!C4,Sheet2!D4,Sheet2!E4,TRUE,TEXT(Sheet2!B4/1000,"$0.0K"),Sheet2!A4,TEXT(Sheet2!D4/1000,"$0.0K"),TEXT(Sheet2!E4/1000,"$0.0K"),{"normal normal 11pt Calibri","normal bold 16pt Calibri","normal normal 9pt Calibri","normal normal 9pt Calibri"},-90,90,0.6,0,{0,1200,"#FFB2BD"},{1200,1500,"#FFDFB0"},{1500,2000,"#BCEAB4"})');
sheet1.addSpan(0, 0, 1, 3, GC.Spread.Sheets.SheetArea.dataArea);
// set style for Row 0
style1 = new GC.Spread.Sheets.Style();
style1.font = "bold 28px Calibri";
style1.foreColor = "white";
style1.backColor = "#14928F";
style1.hAlign = GC.Spread.Sheets.HorizontalAlign.center;
sheet1.setStyle(0, 0, style1, GC.Spread.Sheets.SheetArea.dataArea);
// set style for Row 1
var style = new GC.Spread.Sheets.Style();
style.backColor = "#B4E7E2";
for (var i = 0; i < 3; i++) {
sheet1.setStyle(1, i, style, GC.Spread.Sheets.SheetArea.dataArea);
}
```