# Add Shape-Based Charts

## Content

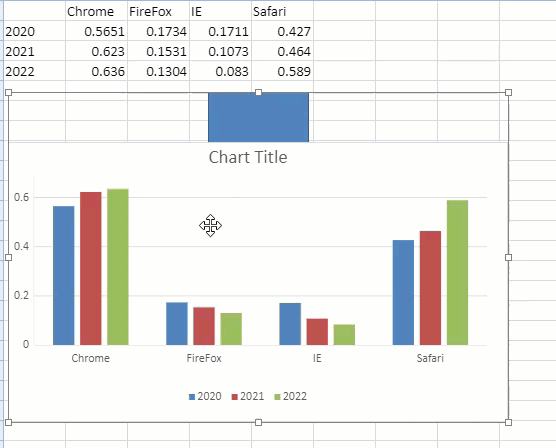
SpreadJS supports shape-based charts that enable you to set the stack order of a positioned element using the **zIndex** method and then use the **group** method to put together all the elements which makes it easily interpretable by the audience.
Refer to the following GIF that depicts a shape-based chart.
![image](https://gcdocumentsitekrblob.blob.core.windows.net/document-site-files/images/d37fbce1-6a37-43ce-b728-dd79fba68421/image.25edd4.png)

To create shape-based charts in the HTML files, references can only be added in the sequence listed below.

```javascript
<script src="scripts/gc.spread.sheets.all.0.0.0.js"></script>
<script src="scripts/plugins/gc.spread.sheets.shapes.0.0.0.js"></script>
<script src="scripts/plugins/gc.spread.sheets.charts.0.0.0.js"></script>
```

However, in the CommonJS project, you don’t need to handle the dependencies manually, the charts package will import the shapes package automatically.

```javascript
import "@grapecity/spread-sheets-charts"
```

The following code sample implements a chart and other shape-based elements.

```javascript
<script src="https://code.jquery.com/jquery-2.2.4.min.js" type="text/javascript"></script>
<link href="css/gc.spread.sheets.0.0.0.css" rel="stylesheet" />
<script src="scripts/gc.spread.sheets.all.0.0.0.min.js"></script>
<script src="scripts/gc.spread.sheets.shapes.0.0.0.min.js"></script>
<script src="scripts/gc.spread.sheets.charts.0.0.0.min.js"></script>
<script>
     $(document).ready(function () {
         var spread = new GC.Spread.Sheets.Workbook(document.getElementById('ss'), { sheetCount: 1 });
         var sheet = spread.getActiveSheet(); 
// Prepare chart data.
sheet.setArray(0, 0, [
     ["", "Chrome", "FireFox", "IE", "Safari"],
     ["2020", 0.5651, 0.1734, 0.1711, 0.427],
     ["2021", 0.623, 0.1531, 0.1073, 0.464],
     ["2022", 0.636, 0.1304, 0.083, 0.589]
]);
// Add chart.
let chart = sheet.charts.add('Chart1', GC.Spread.Sheets.Charts.ChartType.columnClustered, 100, 100, 500, 280, "A1:E4");
// Add shape.
let shape = sheet.shapes.add('Shape1', GC.Spread.Sheets.Shapes.AutoShapeType.rectangle, 300, 50, 100, 100);
// Apply the zIndex method.
sheet.shapes.zIndex('Chart1', 1);
// Apply the group method.
let groupShape = sheet.shapes.group([shape, chart]);
  });
```

> **Note**: Excel IO supports the import and export of shape-based charts, but the zIndex/group/connector information will be lost during the process.