# Export Charts as Image
## Content
You can export charts as image sources in SpreadJS. After inserting the chart in the sheet, you can get the image source using the `chart.toImageSrc()` API.
### Using Code
The following code sample depicts how to save the shape object on spreadsheet as an image source.
```javascript
// Add a column chart.
// Prepare chart data.
sheet.setArray(0, 0, [
["", "Chrome", "FireFox", "IE", "Safari"],
["2020", 51, 34, 11, 27],
["2021", 23, 31, 73, 64],
["2022", 36, 24, 83, 89]
]);
// Add a chart.
let chart = sheet.charts.add('Chart1', GC.Spread.Sheets.Charts.ChartType.columnClustered, 100, 100, 500, 280, "A1:E4");
// Get the chart as an image source.
let chartImageSrc = sheet.charts.all()[0].toImageSrc();
```
### Using Designer
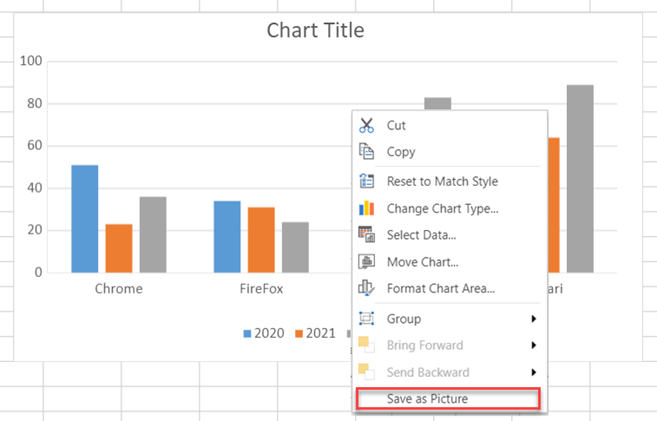
When you select a chart in Spread Designer, you can also save it as an image by clicking the **Save as Picture** option.
Following are the steps to save a chart as an image:
1. Open a worksheet.
2. Insert data as per your requirement.
3. Insert a chart.
4. Right-click on the chart and then click **Save as Picture**.
5. Select the location where you would like to save the image.
6. Name the file and click **Save**.
> **Note**:
>
> * Currently, the exported file format is PNG and the file name is the default object name. For example, **Chart 1**.
> * If multiple chart objects are selected, they will be exported together and all of them will be exported as a file named **SpreadShapes** by default.