# ReportSheet Designer
## Content
SpreadJS Designer Component provides the option to insert a ReportSheet in a workbook.
The **ReportSheet** ribbon button is available in the **INSERT** \> **Sheets** tab group. Clicking on the ribbon button adds a **Report1** tab to the open workbook tabstrip and opens the **REPORT SHEET DESIGN** tab.

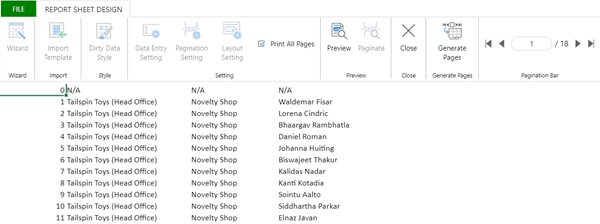
The below image depicts the elements of a report sheet design page.

Follow the steps below to create a new ReportSheet.
### **1\. Import the template\.**
You can import an existing Excel or SJS file as a template to create a report using **REPORT SHEET DESIGN** \> **Import Template**.
Load an existing file and select **OK** to show the imported file in the worksheet. If there are no worksheets in the imported file, a “**No Valid Worksheets**” message appears.

> **Note**: The imported template retains its values and styles when loaded into worksheets.
### **2\. Add DataSource to the ReportSheet**.
You can create a data source by clicking the **DataSource** ribbon button in the **DATA** \> **DATA Binding** tab group. The **DataSource** (TableList) panel also appears on the left side of the panel when you add a ReportSheet.
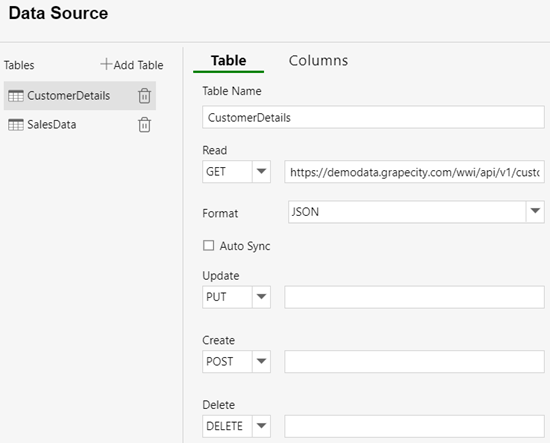
The **DataSource** tab appears, where you can add a table and set the remote URL for CRUD (create, read, update, and delete) capabilities in the **Table** tab.
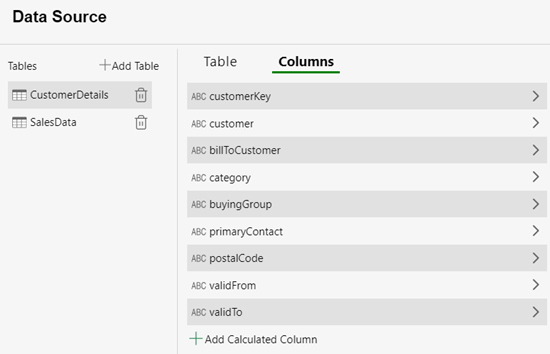
You can also fetch the table data through the **Columns** tab as well.
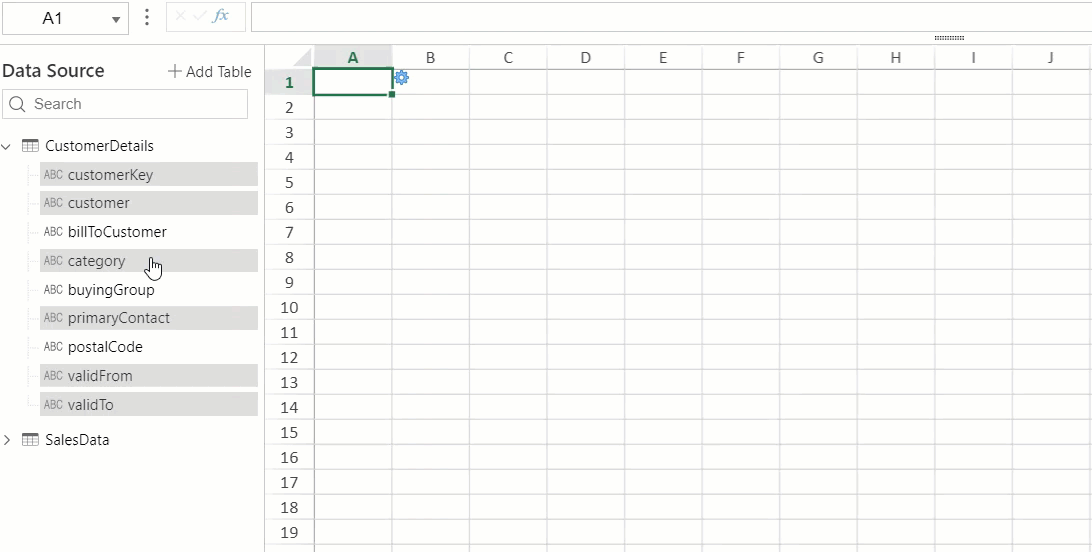
Go to the **Report** tab. You can double-click the table tree node or choose the expand button to view the column names. You can also search the table using the **Search** box.
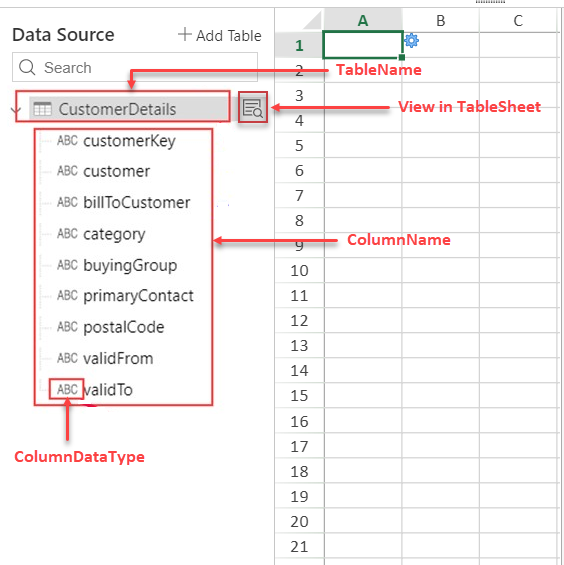
To add the columns in the ReportSheet, select the column names one by one or select multiple columns using the Ctrl key. However, if you want to select continuous column nodes, use the Shift key. Then, drag the selected column nodes and drop them into one report template cell to set all the selected nodes in the tableList according to the fill direction.
> **Notes**:
>
> * If the table column count is out of the sheet’s range, an error “Invalid Range” appears and cancels the drop.
> * The default cell type for the template cell is Group Cell.
### **3\. Set data binding and template cell properties\.**
ReportSheet provides a **Report Cell** panel on the right side where you can select the cell in the ReportSheet to configure the required report-related settings for the report template.
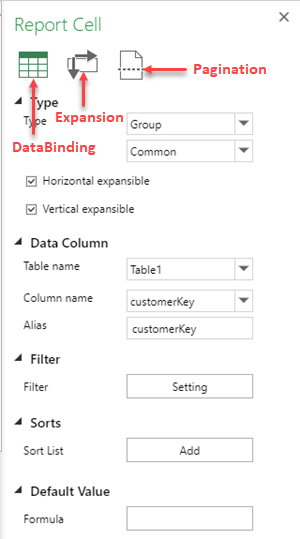
**DataBinding:** To manage the template cell type in the template sheet, you must configure the type and binding option in the template cell.
| Feature | Designer | Remarks |
| ------- | -------- | ------- |
| [Type](/spreadjs/docs/v17/) | 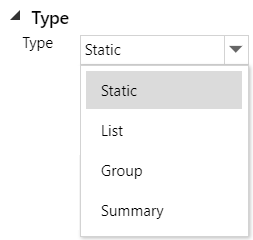 | When a data setting is applied to a template cell, it only affects the current cell's data.
For example, if the template cell is ListCell, only the current cell's data is shown in list mode. |
| Data Column | 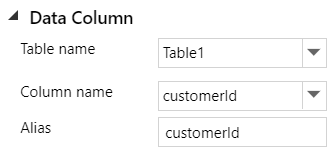 | If the table name is changed, the column names are also changed. |
| [Filter](/spreadjs/docs/v17/) | 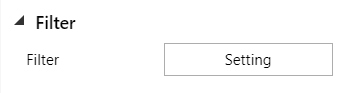 | You can set filter conditions in the template cell to filter data as you join multiple tables.
You can configure the data filtering condition in the template sheet using the below-mentioned settings.
• Filter by Condition
• Filter by Formula |
| [Sort](/spreadjs/docs/v17/) | 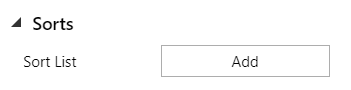 | The template cell can be used to create sort rules for sorting records.
You can reorder or remove the sort rules by clicking up/down/remove. |
| Default Value | 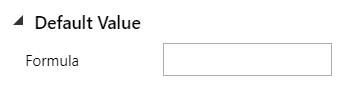 | A **defaultValue** option is a formula that lets you configure how to generate the default value for a newly added record in the report sheet. |
**Expansion:** To set spill direction, collapse specific cells, and add context cells, you must configure the below expansion options.
| Feature | Designer | Description |
| ------- | -------- | ----------- |
| [Spill Direction](/spreadjs/docs/v17/) | 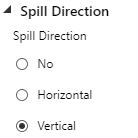 | The Spill direction controls how the data spills in the ReportSheet.
The default value is Vertical. |
| [Collapse Button](/spreadjs/docs/v17/) | 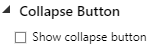 | The showCollapseButton option controls whether to show the button that collapses the children of the cell in the report.
The default value is false. |
| [Context Cells](/spreadjs/docs/v17/) | 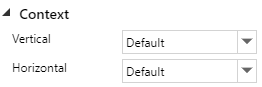 | The context cells option filters the data for all the child cells by default and also affects the report layout.
The default value for context is Default. However, if you switch to Custom, a range selection dialog appears. |
**Pagination:** To configure the pagination settings in the template sheet, you can select one of the below options in the template cell.
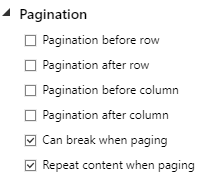
As the report is paginated, the pagination setting of the template cell and the paper size are combined on the ReportSheet.
### **4\. Configure template sheet cell styles\.**
A cell in a ReportSheet can be styled according to the corresponding template cell. The style set in the template sheet is expanded with the current cell expansion.
You can configure the styles by clicking the **REPORT SHEET DESIGN** \> **Dirty Data Style** button. It opens the **Format Cells** dialog with various cell formatting options.
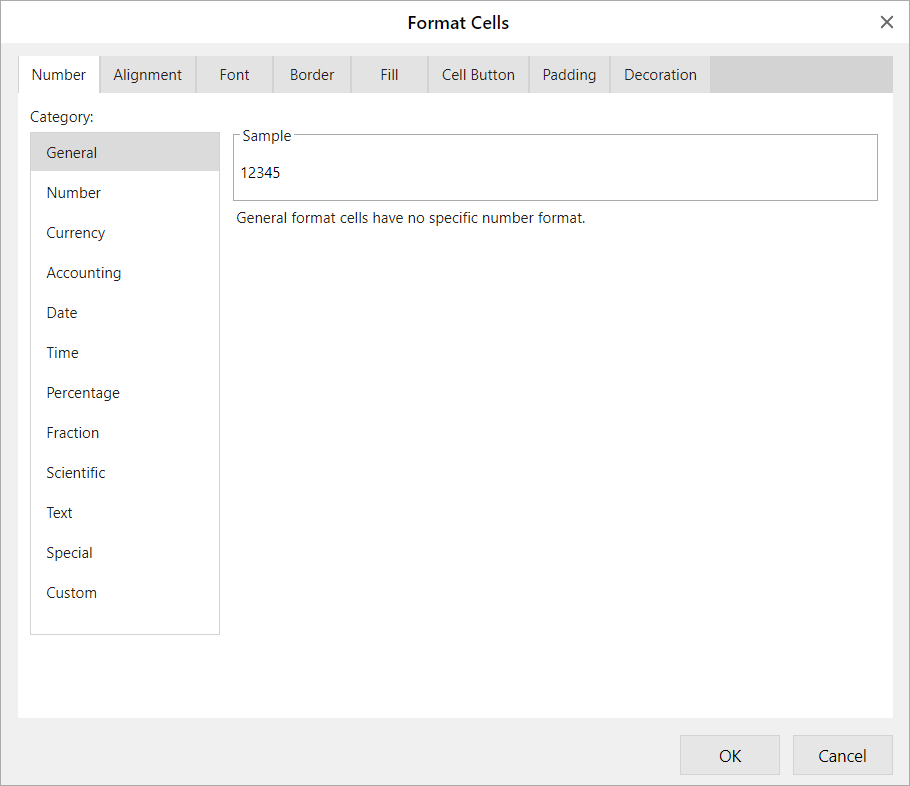
ReportSheet also supports customizing dirty cells, where new data or formulas are added, and the sheet marks those cells as recalculation is required and calls them dirty cells. By default, dirty cells are marked by a red corner fold on the right.
> **Note**: If the template sheet is protected, you can still edit ReportSheet in **Design** mode. A protected ReportSheet only works in **Preview** mode.
### **5\. Set data entry\, pagination\, and layout settings\.**
ReportSheet supports data entry through DataManager. Using the **Data Entry Setting** button, you can configure which cell is written back to which column.
The report sheet also supports formulas and static value fields.

Additionally, you can click on the **Pagination Setting** button to paginate your report using the ReportSheet Designer ribbon.
However, you must adjust the [pagination settings](/spreadjs/docs/v17/) in the template sheet.

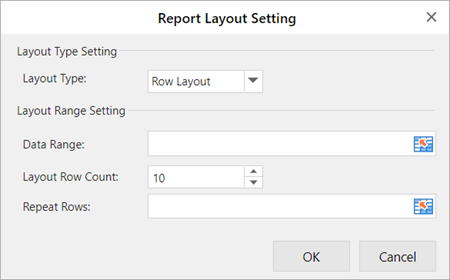
You can also set desired parameters for [configuring layout](/spreadjs/docs/v17/) of a report using the **Layout Setting** button.
### **6\. Check the preview\.**
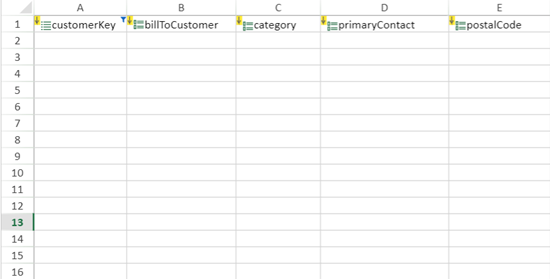
You can click the **Preview** or **Paginate** button to change the [render mode](/spreadjs/docs/v17/). The default render mode of a ReportSheet is **Design**.
* **Design**: Shows the template in the design mode.
* **Preview**: Shows the preview and also supports data entry. You can also enter data using different editors.
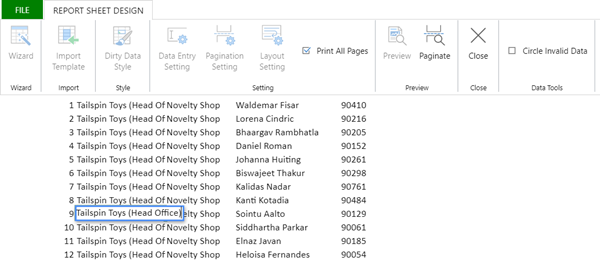
* **Paginated**: Shows the paginated preview, but this mode is read-only so the special appearance of the cell type is removed.