PivotGrid 사용자 정의
사용자 정의 셀
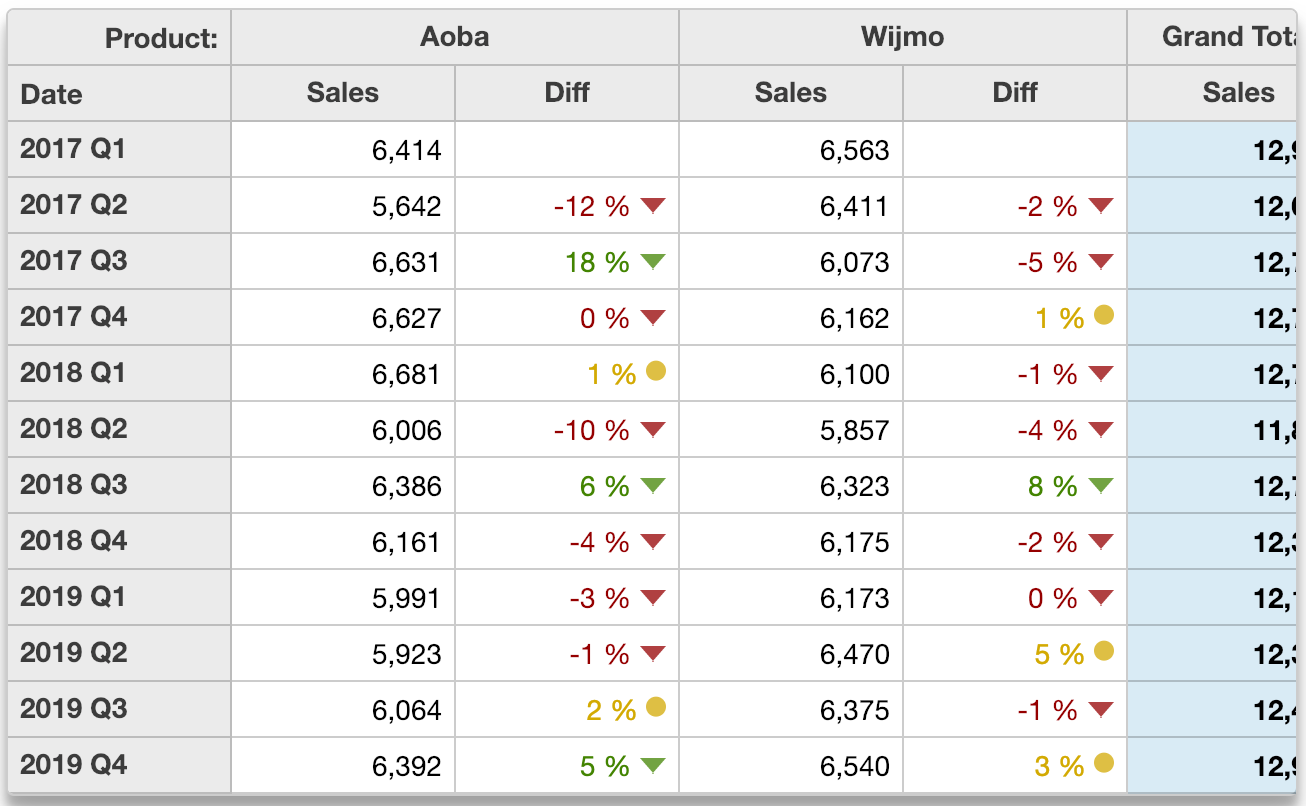
PivotGrid는 FlexGrid 컨트롤을 확장하므로, formatItem 이벤트를 사용하여 그리드 셀의 표시를 사용자 정의할 수 있으며, 각 셀의 내용을 완전히 자유롭게 수정할 수 있습니다.
아래의 PivotGrid는 분기별 판매 변화를 보여주기 위해 Microsoft Excel의 아이콘 세트와 유사한 색상과 아이콘을 사용합니다.:
var pivotGrid = new wjOlap.PivotGrid('#pivotGrid', {
    isReadOnly: true,
    itemsSource: ngFmt,
    formatItem: formatItem // customize the grid cells
});

function formatItem(s, e) {

    // we are interested in the cells panel
    if (e.panel == s.cells) {

    // remove custom color by default
    var color = '';

    // format diff columns if custom formatting is on
    if (e.col % 2 == 1 && customCells.checked) {
        var value = s.getCellData(e.row, e.col),
        glyph = 'circle',
        span = ' <span style="font-size:120%" class="wj-glyph-{glyph}"></span>';
        color = '#d8b400';
        if (value != null) {
        if (value < 0) { // negative variation
            color = '#9f0000';
            glyph = 'down';
        } else if (value > 0.05) { // positive variation
            color = '#4c8f00';
            glyph = 'down';
        }
        e.cell.innerHTML += span.replace('{glyph}', glyph);
        }
    }

    // apply cell color
    e.cell.style.color = color;
    }
}
스파크라인
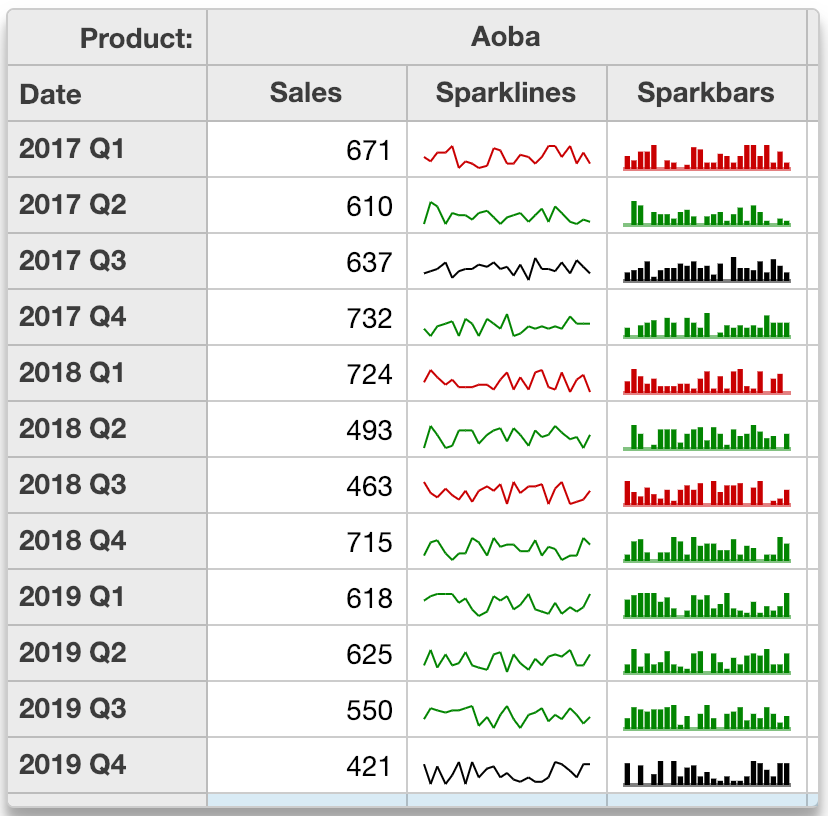
formatItem 이벤트를 사용하여 스파크라인(sparklines)이나 스파크바(sparkbars)와 같은 사용자 정의 콘텐츠를 그리드 셀에 추가할 수도 있습니다.
이 예제는 PivotEngine에 두 개의 필드를 추가하고, formatItem 이벤트를 사용하여 이 추가된 필드에 스파크라인과 스파크바를 추가합니다.
이를 위해 샘플에서는 엔진의 getDetail 메서드를 사용하여 각 셀의 세부 레코드를 가져오고, 그 데이터를 사용하여 각 셀에 표시되는 SVG 요소를 만듭니다. 셀 세부 정보는 데이터 항목에 저장되며, 그리드가 스크롤될 때 다시 사용할 수 있습니다.
아래 예제 코드를 참고하여 주시기 바랍니다.
var pivotGrid = new wjOlap.PivotGrid('#pivotGrid', {
  	isReadOnly: true,
    itemsSource: ng,
    formatItem: formatItem // customize the grid cells
});

// use formatItem to add sparklines and/or sparkbars
var maxSparkLength = 25;
function formatItem(s, e) {

  	// we want the cells panel
	if (e.panel == s.cells) {

			// we want the 'Sparklines' and 'Sparkbars' value fields
		var ng = s.engine,
      		field = ng.valueFields[e.col % ng.valueFields.length],
        	item = s.rows[e.row].dataItem,
        	binding = s.columns[e.col].binding,
        	spark = field.header == 'Sparklines' || field.header == 'Sparkbars';

		// add/remove spark class
    	wijmo.toggleClass(e.cell, 'spark', spark);

      	// add sparklines
      	if (spark) {

			// if we have the data, show it
			if (item.sparkData) {
				var data = item.sparkData,
					delta = data[data.length -1] - data[0];
					e.cell.innerHTML = field.header == 'Sparklines' ? getSparklines(item.sparkData) : getSparkbars(item.sparkData);
				wijmo.toggleClass(e.cell, 'spark-up', delta > 0);
				wijmo.toggleClass(e.cell, 'spark-down', delta < 0);
			}

        	// we dont have the data yet, so go get it
        	if (!item.sparkData) {
        		e.cell.innerHTML = '';
          		setTimeout(function() {
          			var detail = s.engine.getDetail(item, binding),
								len = detail.length;
					if (len > maxSparkLength) {
						detail = detail.slice(len - maxSparkLength);
					}
					item.sparkData = detail.map(function(dataItem) {
						return dataItem.sales;
					});
					s.invalidate(); // invalidate to show the sparlines
				});
        	}
      	}
    }
}

// generate sparklines as SVG
function getSparklines(data) {
	var svg = '<svg width="100%" height="100%">',
		min = Math.min.apply(Math, data),
		max = Math.max.apply(Math, data),
		x1 = 0,
		y1 = scaleY(data[0], min, max);
		for (var i = 1; i < data.length; i++) {
			var x2 = Math.round((i) / (data.length - 1) * 100),
				y2 = scaleY(data[i], min, max);
			svg += '<line x1=' + x1 + '% y1=' + y1 + '% x2=' + x2 + '% y2=' + y2 + '% />';
			x1 = x2;
			y1 = y2;
		}
		svg += '</svg>';
		return svg;
}
function getSparkbars(data) {
	var svg = '<svg width="100%" height="100%">',
        min = Math.min.apply(Math, data),
        max = Math.max.apply(Math, data),
    	base = Math.min(max, Math.max(min, 0)),
    	basey = scaleY(base, min, max),
    	w = Math.round(100 / data.length) - 2;
    for (var i = 0; i < data.length; i++) {
    	var x = i * Math.round(100 / data.length) + 1,
            y = scaleY(data[i], min, max);
        svg += '<rect x=' + x + '% width=' + w + '% y=' + Math.min(y, basey) + '% height=' + Math.abs(y - basey) + '% />';
	}
	svg += '<rect x=0% width=100% height=1 y=' + basey + '% opacity=.5 />';
	svg += '</svg>';
	return svg;
}
function scaleY(value, min, max) {
	return 100 - Math.round((value - min) / (max - min) * 100);
}
HTML 컨텐츠
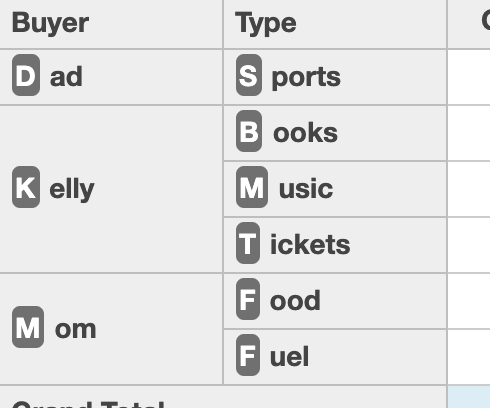
PivotField의 isContentHtml 속성을 사용하여 일반 텍스트 대신 HTML을 포함하는 필드를 렌더링할 수 있습니다.
예를 들어, 아래 배열에서 "Buyer"와 "Type" 필드는 HTML 텍스트를 포함하는 속성에 바인딩되어 있습니다.
[
	{
		date: new Date(yr, 0, 1),
		buyer: '<span class="initial">M</span>om',
		type: '<span class="initial">F</span>uel',
		amount: 74
	},
	{
		date: new Date(yr, 0, 15),
		buyer: '<span class="initial">M</span>om',
		type: '<span class="initial">F</span>ood',
		amount: 235
	},
	{
		date: new Date(yr, 0, 17),
		buyer: '<span class="initial">D</span>ad',
		type: '<span class="initial">S</span>ports',
		amount: 20
	},
	{
		date: new Date(yr, 0, 21),
		buyer: '<span class="initial">K</span>elly',
		type: '<span class="initial">B</span>ooks',
		amount: 125
	},
	{
		date: new Date(yr, 1, 2),
		buyer: '<span class="initial">M</span>om',
		type: '<span class="initial">F</span>ood',
		amount: 235
	},
	{
	date: new Date(yr, 1, 20),
	buyer: '<span class="initial">K</span>elly',
	type: '<span class="initial">M</span>usic',
	amount: 20
	},
	{
	date: new Date(yr, 1, 25),
	buyer: '<span class="initial">K</span>elly',
	type: '<span class="initial">T</span>ickets',
	amount: 125
	},
];
컨텐츠가 HTML로 렌더링되도록 하려면, isContentHTML 속성을 true로 설정하세요.
var ng = new wjOlap.PivotEngine({
    itemsSource: getData(), // raw data
    valueFields: ['Amount'], // summarize amounts
    rowFields: ['Buyer', 'Type'] // summarize amounts
});

ng.fields.getField('Buyer').isContentHtml = true;
ng.fields.getField('Type').isContentHtml = true;
결과