- SpreadJS 개요
- 시작하기
- JavaScript 프레임워크
- 모범 사례
- 기능
- SpreadJS 템플릿 디자이너
- SpreadJS 디자이너 VSCode 플러그인
- 튜토리얼
- SpreadJS 디자이너 컴포넌트
- SpreadJS 동시 작업 서버
- 터치 지원
- 수식 참조
- 가져오기 및 내보내기 참조
- 이벤트
- API 문서
- 릴리스 노트
폭포 차트
폭포 차트는 연속적인 양수 및 음수 값이 누적 합계에 어떻게 기여하는지를 보여줍니다. 일반적으로 이익 변화, 예산 차이, 판매 실적 또는 기타 증분 값의 변화를 분석하는 데 사용됩니다.
각 막대는 개별 기여도를 나타내며, 마지막 막대는 선택적으로 누적 합계를 표시할 수 있습니다.
범주 구성
폭포 차트는 하나의 범주 필드를 사용합니다.
여러 범주 수준이 바인딩된 경우 첫 번째 수준만 사용됩니다. 중첩된 범주 수준은 무시되며 표시되지 않습니다.
예측 가능한 레이블 동작을 위해 폭포 차트를 구성할 때는 단일 수준 범주 필드를 사용하는 것이 좋습니다.
기본 폭포 차트
다음 예제는 최소한의 폭포 차트 구성을 생성합니다.
const sheet = spread.getActiveSheet();
sheet.name("Waterfall Chart");

const dataChart = sheet.dataCharts.add(
  'waterfall-chart',
  10, 10, 600, 400,
  GC.Spread.Sheets.DataCharts.DataChartType.waterfall
);

dataChart.setChartConfig({
  tableName: 'Profits',
  plots: [{
    type: GC.Spread.Sheets.DataCharts.DataChartType.waterfall,
    encodings: {
      values: [{
        field: 'Value',
        aggregate: GC.Spread.Sheets.DataCharts.Aggregate.sum
      }],
      category: {
        field: 'Category'
      }
    }
  }]
});
폭포 차트 전용 설정
폭포 차트는 config.waterfall 객체 아래에 전용 구성 옵션을 제공합니다.
속성 | 설명 | 미리 보기 |
|---|---|---|
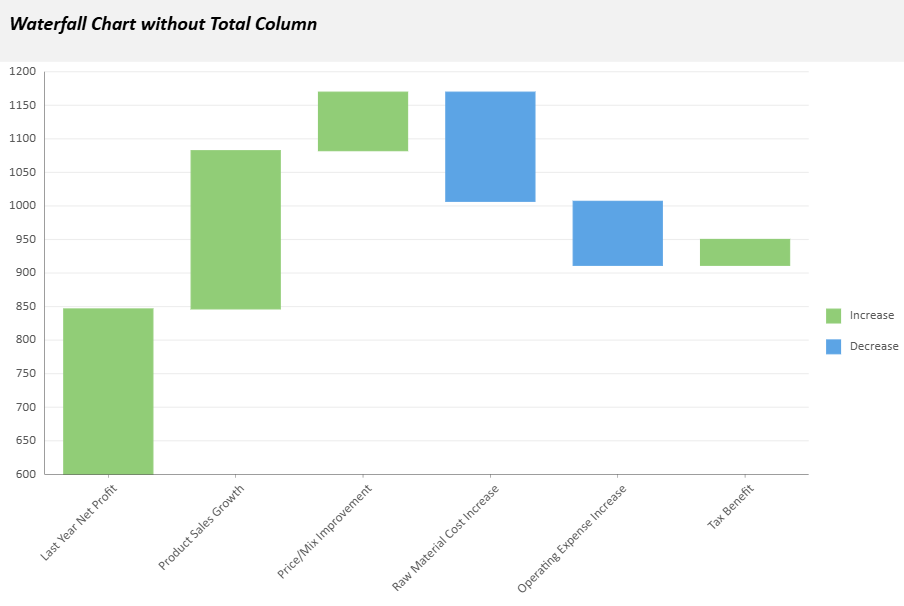
| 차트에 최종 합계 막대를 표시할지 여부를 제어합니다.
|
|
| 합계 열에 사용할 텍스트 레이블을 지정합니다(기본값: |
|
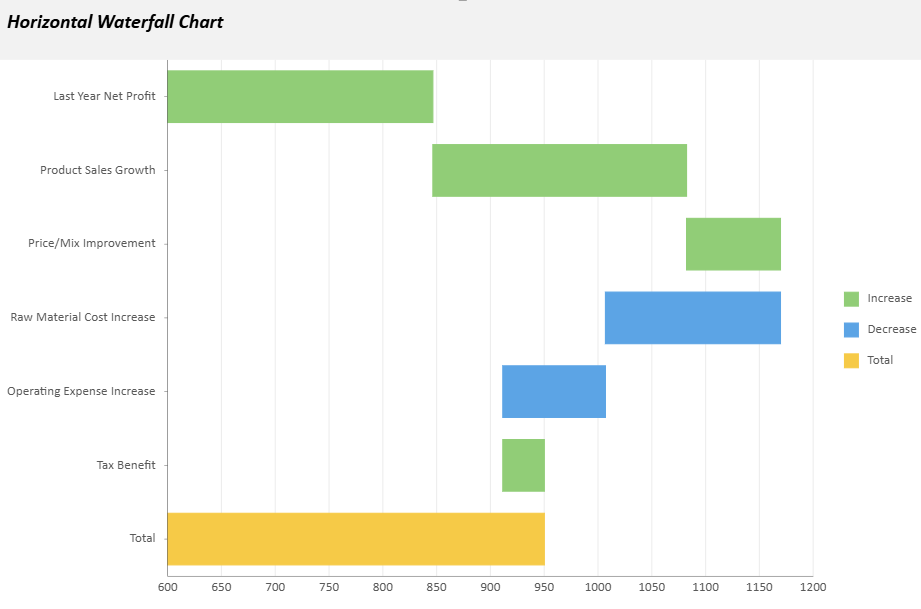
| 차트 방향을 지정합니다. |
|
| 막대 사이를 연결하는 선의 스타일을 정의합니다. 다음 속성을 사용자 지정할 수 있습니다.
|
|


예제 구성:
config: {
waterfall: {
showTotal: true,
totalLabel: "Net Profit",
orientation: "vertical",
connectingLineStyle: {
stroke: { type: 'CssColor', color: 'red' },
strokeWidth: 2,
strokeDasharray: "5,5"
}
}
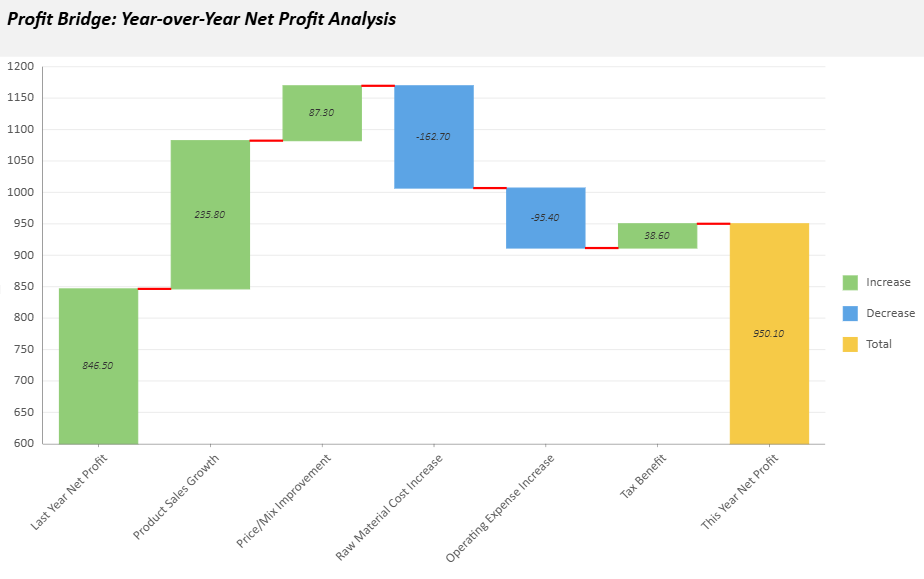
}고급 예제
다음 샘플은 전년 대비 순이익 분석을 위한 폭포 차트를 생성합니다. 사용자 지정 차트 구성, 텍스트 스타일, 도구 설명 및 애니메이션 효과가 포함되어 있습니다.
// Basic setup
const sheet = spread.getActiveSheet();
sheet.name("Waterfall Data Chart");
const dataManager = spread.dataManager();

function createProfitsTable(dataManager) {
    const records = [
        ["Last Year Net Profit", 846.5],
        ["Product Sales Growth", 235.8],
        ["Price/Mix Improvement", 87.3],
        ["Raw Material Cost Increase", -162.7],
        ["Operating Expense Increase", -95.4],
        ["Tax Benefit", 38.6],
    ];
  const columns = ["Category", "Value"];
  return dataManager.addTable("Profits", {
    data: records.map(record => {
      const item = {};
      columns.forEach((column, index) => item[column] = record[index]);
      return item;
    }),
  });
}

const ProfitsTable = createProfitsTable(dataManager);
await ProfitsTable.fetch();

// Create a waterfall data chart
const dataChart = sheet.dataCharts.add('WaterfallChart6', 10, 10, 600, 400);
dataChart.setChartConfig({
  tableName: 'Profits',
  plots: [{
    type: GC.Spread.Sheets.DataCharts.DataChartType.waterfall,
    encodings: {
      values: [{ field: 'Value', aggregate: GC.Spread.Sheets.DataCharts.Aggregate.sum }],
      category: { field: 'Category' },
    },
    config: {
      waterfall: {
        totalLabel: 'This Year Net Profit',
        connectingLineStyle: {
          stroke: { type: 'CssColor', color: 'red' },
          strokeWidth: 2,
        },
      },
      text: [{
        template: '{valueField.value}',
        format: { value: '0.00' },
        overlappingLabels: 'Hide',
        position: GC.Spread.Sheets.DataCharts.TextPosition.center,
        textStyle: {
          fontFamily: 'Calibri',
          fontSize: 10,
          fontWeight: 'Lighter',
          fontStyle: GC.Spread.Sheets.DataCharts.FontStyle.italic,
          color: '#333333',
        },
      }],
      tooltip: [{
        style: {
          fill: { type: 'CssColor', color: '#ffffff' },
          stroke: { type: 'CssColor', color: '#e0e0e0' },
          strokeWidth: 1,
        },
        textStyle: {
          fontFamily: 'Calibri',
          fontSize: 12,
          fontWeight: 'Lighter',
          fontStyle: GC.Spread.Sheets.DataCharts.FontStyle.italic,
          color: '#333333',
        },
      }],
      hoverAnimation: {
        duration: 400,
        easing: GC.Spread.Sheets.DataCharts.AnimationEasing.linear,
        scale: 1.5,
      },
      updateAnimation: {
        startDelay: 200,
        duration: 1000,
        easing: GC.Spread.Sheets.DataCharts.AnimationEasing.linear,
      },
    },
  }],
    config: {
    header: {
      title: 'Profit Bridge: Year-over-Year Net Profit Analysis',
      padding: {
        left: 10,
        right: 10,
        top: 10,
        bottom: 20,
      },
   style: {
        fill: { type: 'CssColor', color: '#f2f2f2' },
    },
      textStyle: {
        color: 'black',
        fontSize: 18,
        fontStyle: GC.Spread.Sheets.DataCharts.FontStyle.italic,
        fontWeight: 'Bold',
        alignment: GC.Spread.Sheets.DataCharts.HAlign.left,
      },
    },
  },
});