- SpreadJS Overview
- Getting Started
- JavaScript Frameworks
- Best Practices
-
Features
- Workbook
- Worksheet
- Rows and Columns
- Headers
- Cells
- Data Binding
- TableSheet
- GanttSheet
- JSON Schema with SpreadJS
- SpreadJS File Format
- Data Validation
- Conditional Formatting
- Sort
- Group
- Formulas
- Serialization
- Keyboard Actions
- Shapes
- Form Controls
- Floating Objects
- Barcodes
- Charts
- Sparklines
- Tables
- Pivot Table
- Slicer
- Theme
- Culture
- SpreadJS Designer
- SpreadJS Designer Component
- Touch Support
- Formula Reference
- Import and Export Reference
- Frequently Used Events
- API Documentation
- Release Notes
Headers
SpreadJS allows you to perform various operations on cell headers.
Set Height and Width of Header
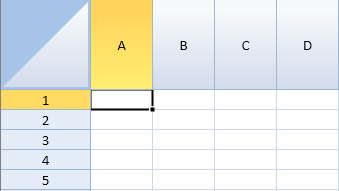
This example changes the column header height and row header width.
$(document).ready(function () {
   // Initializing Spread
   var spread =new GC.Spread.Sheets.Workbook(document.getElementById("ss"),{sheetCount:3});
   // Get the activeSheet
   var sheet = spread.getActiveSheet();

   // Change the column header height.
   sheet.setRowHeight(0, 90.0,GC.Spread.Sheets.SheetArea.colHeader);
   // Change the row header width.
   sheet.setColumnWidth(0, 90.0,GC.Spread.Sheets.SheetArea.rowHeader);
});
Set Header Text
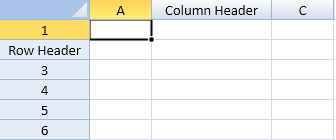
This example puts custom text in the headers.
$(document).ready(function () {
    // Initializing Spread
    var spread = new GC.Spread.Sheets.Workbook(document.getElementById("ss"),{sheetCount:3});
    // Get the activeSheet
    var sheet = spread.getActiveSheet();

    // Set the desired string in headers    sheet.setValue(0, 1, "Column Header", GC.Spread.Sheets.SheetArea.colHeader);
    sheet.setValue(1, 0, "Row Header", GC.Spread.Sheets.SheetArea.rowHeader);
    sheet.setColumnWidth(1, 120.0,GC.Spread.Sheets.SheetArea.colHeader);
    sheet.setColumnWidth(0, 90.0,GC.Spread.Sheets.SheetArea.rowHeader);
});
Set Header Color

This example sets the backcolor and forecolor for the header.
$(document).ready(function () {
   // Initializing Spread
   var spread = new GC.Spread.Sheets.Workbook(document.getElementById("ss"),{sheetCount:3});
   // Get the activeSheet
   var sheet = spread.getActiveSheet();

   // Set the backcolor and forecolor for the entire column header.
   var row = sheet.getRange(0, -1, 1, -1, GC.Spread.Sheets.SheetArea.colHeader);
   row.backColor("Red");
   row.foreColor("White");

    // Set the backcolor of second row header.
    sheet.getCell(1, 0, GC.Spread.Sheets.SheetArea.rowHeader).backColor("Yellow");
});
Hide Headers
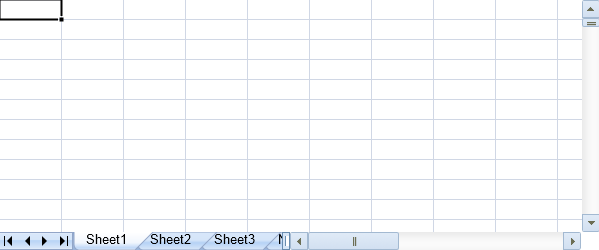
This example hides the headers.
$(document).ready(function () {
    // Initializing Spread
    var spread = new GC.Spread.Sheets.Workbook(document.getElementById("ss"),{sheetCount:3});
    // Get the activeSheet
    var activesheet = spread.getActiveSheet();

    // Hide column headers.
    activeSheet.options.colHeaderVisible = false;

    // Hide row headers.
    activeSheet.options.rowHeaderVisible = false;
});
Span or Merge HeaderCells
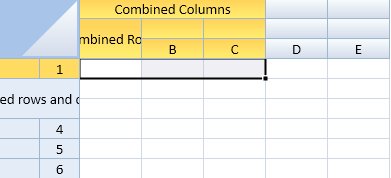
The following code spans cells in the headers.
$(document).ready(function () {
    // Initializing Spread
    var spread = new GC.Spread.Sheets.Workbook(document.getElementById("ss"),{sheetCount:3});
    // Get the activeSheet
    var activeSheet = spread.getActiveSheet();

    // Set the row count of column header to 3.
    activeSheet.setRowCount(3, GC.Spread.Sheets.SheetArea.colHeader);

    // Span three columns with the origin at column header cell (0,0).
    activeSheet.addSpan(0, 0, 1, 3, GC.Spread.Sheets.SheetArea.colHeader);

    // Merge two rows having origin at column header cell(1,0).
    activeSheet.addSpan(1, 0, 2, 1, GC.Spread.Sheets.SheetArea.colHeader);

    // Set strings to the merged cells.
    activeSheet.setValue(0, 0, "Combined Columns", GC.Spread.Sheets.SheetArea.colHeader);
    activeSheet.setValue(1, 0, "Combined Rows", GC.Spread.Sheets.SheetArea.colHeader);

    // Set number of columns of row header to 2.
    activeSheet.setColumnCount(2, GC.Spread.Sheets.SheetArea.rowHeader);

    // Merge two columns and two rows with the origin at row header cell (1,0).
    activeSheet.addSpan(1, 0, 2, 2, GC.Spread.Sheets.SheetArea.rowHeader);

    // Set strings to those merged cells.
    activeSheet.setValue(1, 0, "Combined rows and columns", GC.Spread.Sheets.SheetArea.rowHeader);
});
Create Multiple Columns and Rows in Headers
You can display multiple column and row headers and specify whether to show letters, numbers, or nothing in the default header. You can also put custom text in the headers. You can use setRowCount and setColumnCount methods to specify the count.
Clicking on a header will select that row or column by default. You can also resize a column or row by moving the pointer over the line at the edge of a header. The pointer changes to a double arrow and you can then drag the column or row to the new width or height.
You can use the options.colHeaderAutoTextIndex , options.colHeaderAutoText , options.rowHeaderAutoTextIndex , and options.rowHeaderAutoText properties in code to change the default header text.
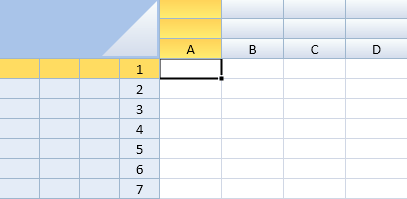
Using Code
This example creates multiple rows and columns in the header.
// Initializing Spread
var spread = new GC.Spread.Sheets.Workbook(document.getElementById("ss"),{sheetCount:3});
// Get the activeSheet
var activeSheet = spread.getActiveSheet();
// Set number of rows for column headers to 3.
activeSheet.setRowCount(3, GC.Spread.Sheets.SheetArea.colHeader);
//Set number of columns for row header to 4.
activeSheet.setColumnCount(4, GC.Spread.Sheets.SheetArea.rowHeader);});
This example specifies the type and location of the header text and creates custom header text.
activeSheet.setRowCount(2,GC.Spread.Sheets.SheetArea.colHeader);
activeSheet.setColumnCount(2,GC.Spread.Sheets.SheetArea.rowHeader);
activeSheet.setValue(0, 2,"Column",GC.Spread.Sheets.SheetArea.colHeader);
activeSheet.options.rowHeaderAutoTextIndex = 1;
activeSheet.options.rowHeaderAutoText = GC.Spread.Sheets.HeaderAutoText.numbers;
activeSheet.options.colHeaderAutoTextIndex = 1;
activeSheet.options.colHeaderAutoText = GC.Spread.Sheets.HeaderAutoText.letters;
Add/ Delete Row and Column in Header
You can add rows or columns at a specific location in the header using the addRows and addColumns methods. They accept parameters such as the row or column index and the number of rows and columns to add.
Similarly, you can delete header rows and columns from a specific location using the deleteRows and deleteColumns methods.
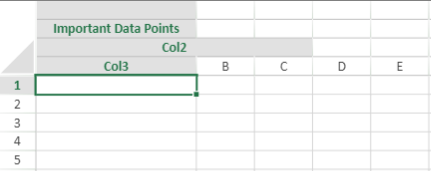
The following code example shows how to add rows in column header at specific location.
// add rows to column headers
activeSheet.addRows(0, 1, GC.Spread.Sheets.SheetArea.colHeader);
// add column to row headers
activeSheet.addColumns(1, 3, GC.Spread.Sheets.SheetArea.rowHeader);
Note: The colHeaderAutoTextIndex and rowHeaderAutoTextIndex options are not automatically adjusted by the addRows/ addColumns/ deleteRows/ deleteColumns methods.
Get Header Cell Index from Mouse Click
This example gets the index of the header cell when selecting it with the mouse.
$(document).ready(function () {
    var spread = new GC.Spread.Sheets.Workbook($("#ss")[0]);
    var activeSheet = spread.getActiveSheet();
    activeSheet.setRowCount(4, GC.Spread.Sheets.SheetArea.colHeader);
    $("#ss").click(function (e)

    // Acquire cell index from the mouse-clicked point of column header cells.
    var offset = $("#ss").offset();
    var x = e.pageX - offset.left;
    var y = e.pageY - offset.top;
    var target = spread.getActiveSheet().hitTest(x, y);

     if(target &&target.rowViewportIndex === -1 &&
     (target.colViewportIndex === 0 || target.colViewportIndex === 1))
         {
            console.log("Row index of mouse-clicked column header cells: " + target.row);            console.log("Column index of mouse-clicked column header cells: " + target.col);         }
});
Adding Formula and Sparkline in Headers
You can add formula (average, minimum, maximum, etc.) and SparklineEx (LineSparkline, ColumnSparkline, WinlossSparkline, CascadeSparkline, PieSparkline etc. )to both the row header area and column header area of the spreadsheet. The user can conveniently bind the data source to make data visualization and data aggregation in the header area. Also, it helps in displaying the overall progress and analyzing the errors in data without having to go through all the data values. Adding formulas in the headers works like frozen rows and columns, which will always be displayed no matter where the user scrolls.
Let's take an example where performance of three employees in an organization, Andrey, Michael, and John in the past 8 years, between 2012 and 2019 is being evaluated. In the use-case image depicted below, "Actual Sales" represents the sum of sales done by 3 employees in a particular year and "Sales Target" represents the targeted sale of a company in a particular year. Further, "Sales Deficit" represents the difference between Actual Sales and Sales Target.
Here, we are representing a dashboard for sales performance analysis wherein we are using LineSparkline formulas in column header to represent employee's sales over the past 8 years and ColumnSparkline formulas in column header to represent Actual Sales and Sales Target. Further, the WinLossSparkline formula in Sales Deficit column header represents the difference between Actual Sales and Sales Target.
Again, to display data aggregation in column header, we have used built-in function formulas and depicted the minimum, average and maximum sales of the employee, Actual Sales, Sales Target and Sales Deficit.
When using SparklineEx and data aggregation formulas in a dashboard form, users can easily identify the performance on different parameters rather than going through the actual values.

Using Code
The following code snippet shows the use of SparklineEx and formulas in header:
        $(document).ready(function () {
            // initializing Spread
            var spread = new GC.Spread.Sheets.Workbook(document.getElementById('ss'), { sheetCount: 2 });
            spread.suspendPaint();
            // get the activeSheet
            var activeSheet = spread.sheets[0];
            // set sheetAreaOffset option
            activeSheet.options.sheetAreaOffset = { left: 1, top: 1 };
            // Hide gridlines
            activeSheet.options.gridline = { showVerticalGridline: false, showHorizontalGridline: false };
            // Hide row headers
            activeSheet.options.rowHeaderVisible = false;
            // set row and column count
            activeSheet.setRowCount(8, 3);
            activeSheet.setColumnCount(8, 3);
            // set column width
            activeSheet.setColumnWidth(0, 100);
            for (var i = 1; i < 7; i++)
                activeSheet.setColumnWidth(i, 180);
            // Create dataArray
            var dataArray =
                [
                    [2012, 242, 234, 135, , 700],
                    [2013, 234, 244, 522, , 900],
                    [2014, 214, 322, 111, , 500],
                    [2015, 23, 114, 45, , 300],
                    [2016, 222, 152, 345, , 700],
                    [2017, 22, 633, 622, , 1000],
                    [2018, 533, 634, 211, , 1700],
                    [2019, 111, 22, 442, , 600],
                ];
            // set data for chart
            activeSheet.setArray(0, 0, dataArray);
            // set column header data for row 0 and its setting
            activeSheet.setValue(0, 0, "EMPLOYEE SALES PERFORMANCE ( Million $)", GC.Spread.Sheets.SheetArea.colHeader);
            activeSheet.getRange(-1, 0, -1, 7).hAlign(GC.Spread.Sheets.HorizontalAlign.center);
            activeSheet.setRowHeight(0, 35, GC.Spread.Sheets.SheetArea.colHeader)
            activeSheet.addSpan(0, 0, 1, 7, GC.Spread.Sheets.SheetArea.colHeader);
            // set column header row count
            activeSheet.setRowCount(4, 1);
            // set column header data for row 1
            activeSheet.setValue(1, 0, 'Year', GC.Spread.Sheets.SheetArea.colHeader);
            activeSheet.setValue(1, 1, 'Andrey', GC.Spread.Sheets.SheetArea.colHeader);
            activeSheet.setValue(1, 2, 'Michael', GC.Spread.Sheets.SheetArea.colHeader);
            activeSheet.setValue(1, 3, 'John', GC.Spread.Sheets.SheetArea.colHeader);
            activeSheet.setValue(1, 4, 'Actual Sales', GC.Spread.Sheets.SheetArea.colHeader);
            activeSheet.setValue(1, 5, 'Sales Target', GC.Spread.Sheets.SheetArea.colHeader);
            activeSheet.setValue(1, 6, 'Sales Deficit', GC.Spread.Sheets.SheetArea.colHeader);
            // set formula for column "Actual Sales" & column "Sales Deficit"
            for (var i = 1; i < 9; i++) {
                activeSheet.setFormula(i - 1, 4, "SUM(B" + i + "+C" + i + "+D" + i + ")", GC.Spread.Sheets.SheetArea.viewport);
                activeSheet.setFormula(i - 1, 6, "E" + i + "-F" + i, GC.Spread.Sheets.SheetArea.viewport);
            }
            // set border for dataArea cells
            activeSheet.getRange("A1:G8").setBorder(
                new GC.Spread.Sheets.LineBorder("black", GC.Spread.Sheets.LineStyle.thick),
                { top: true, bottom: true, left: true, right: true }, GC.Spread.Sheets.SheetArea.viewport);


            activeSheet.addSpan(2, 5, 1, 2, GC.Spread.Sheets.SheetArea.colHeader);
            activeSheet.setRowHeight(2, 60, GC.Spread.Sheets.SheetArea.colHeader);
            activeSheet.setText(2, 4, "WIN/ LOSS CHART", GC.Spread.Sheets.SheetArea.colHeader);
            // Add Chart by using sparklineEx formulas in header
            activeSheet.setFormula(2, 1, '=LINESPARKLINE(Sheet1!B1:B8,0,,,"{seriesColor:#02888F,highMarkerColor:#FFD34C,lowMarkerColor:#E89796,lineWeight:3,displayEmptyCellsAs:0,showHigh:true,showLow:true,maxAxisType:0,minAxisType:0}")', GC.Spread.Sheets.SheetArea.colHeader);
            activeSheet.setFormula(2, 2, '=LINESPARKLINE(Sheet1!C1:C8,0,,,"{seriesColor:#02888F,highMarkerColor:#FFD34C,lowMarkerColor:#E89796,lineWeight:3,displayEmptyCellsAs:0,showHigh:true,showLow:true,maxAxisType:0,minAxisType:0}")', GC.Spread.Sheets.SheetArea.colHeader);
            activeSheet.setFormula(2, 3, '=LINESPARKLINE(Sheet1!D1:D8,0,,,"{seriesColor:#02888F,highMarkerColor:#FFD34C,lowMarkerColor:#E89796,lineWeight:3,displayEmptyCellsAs:0,showHigh:true,showLow:true,maxAxisType:0,minAxisType:0}")', GC.Spread.Sheets.SheetArea.colHeader);
            activeSheet.setFormula(2, 4, '=COLUMNSPARKLINE(Sheet1!E1:E8,0,,,"{seriesColor:#02888F,highMarkerColor:#FFD34C,lowMarkerColor:#E89796,lineWeight:3,displayEmptyCellsAs:0,showHigh:true,showLow:true,maxAxisType:0,minAxisType:0}")', GC.Spread.Sheets.SheetArea.colHeader);
            activeSheet.setFormula(2, 5, '=COLUMNSPARKLINE(Sheet1!F1:F8,0,,,"{seriesColor:#02888F,highMarkerColor:#FFD34C,lowMarkerColor:#E89796,lineWeight:3,displayEmptyCellsAs:0,showHigh:true,showLow:true,maxAxisType:0,minAxisType:0}")', GC.Spread.Sheets.SheetArea.colHeader);
            activeSheet.setFormula(2, 6, '=WINLOSSSPARKLINE(Sheet1!G1:G8,0,,,"{seriesColor:#02888F,highMarkerColor:#FFD34C,lowMarkerColor:#E89796,displayEmptyCellsAs:0,showHigh:true,showLow:true,maxAxisType:0,minAxisType:0}")', GC.Spread.Sheets.SheetArea.colHeader);
            // Data aggregation by using built-in function formulas in header
            activeSheet.setFormula(3, 0, '"From "&COUNT(Sheet1!A:A)&" Years"', GC.Spread.Sheets.SheetArea.colHeader);
            activeSheet.setFormula(3, 1, '"Min: "&MIN(Sheet1!B:B)&" Avg: "&ROUND(AVERAGE(Sheet1!B:B),0)&" Max: "&MAX(Sheet1!B:B)', GC.Spread.Sheets.SheetArea.colHeader);
            activeSheet.setFormula(3, 2, '"Min: "&MIN(Sheet1!C:C)&" Avg: "&ROUND(AVERAGE(Sheet1!C:C),0)&" Max: "&MAX(Sheet1!C:C)', GC.Spread.Sheets.SheetArea.colHeader);
            activeSheet.setFormula(3, 3, '"Min: "&MIN(Sheet1!D:D)&" Avg: "&ROUND(AVERAGE(Sheet1!D:D),0)&" Max: "&MAX(Sheet1!D:D)', GC.Spread.Sheets.SheetArea.colHeader);
            activeSheet.setFormula(3, 4, '"Min: "&MIN(Sheet1!E:E)&" Avg: "&ROUND(AVERAGE(Sheet1!E:E),0)&" Max: "&MAX(Sheet1!E:E)', GC.Spread.Sheets.SheetArea.colHeader);
            activeSheet.setFormula(3, 5, '"Min: "&MIN(Sheet1!F:F)&" Avg: "&ROUND(AVERAGE(Sheet1!F:F),0)&" Max: "&MAX(Sheet1!F:F)', GC.Spread.Sheets.SheetArea.colHeader);
            activeSheet.setFormula(3, 6, '"Min: "&MIN(Sheet1!G:G)&" Avg: "&ROUND(AVERAGE(Sheet1!G:G),0)&" Max: "&MAX(Sheet1!G:G)', GC.Spread.Sheets.SheetArea.colHeader);
            // set style of column header Row 0
            var style1 = new GC.Spread.Sheets.Style();
            style1.font = "bold 18px Arial";
            style1.foreColor = "black";
            style1.backColor = "#9FD5B7";
            style1.hAlign = GC.Spread.Sheets.HorizontalAlign.center;
            style1.vAlign = GC.Spread.Sheets.VerticalAlign.center;
            activeSheet.setStyle(0, 0, style1, GC.Spread.Sheets.SheetArea.colHeader);
            // set style of column header Row 1 & 3
            var style = new GC.Spread.Sheets.Style();
            style.font = "bold 12px Arial";
            style.foreColor = "black";
            style.backColor = "#D3F0E0";
            style.hAlign = GC.Spread.Sheets.HorizontalAlign.center;
            style.vAlign = GC.Spread.Sheets.VerticalAlign.center;
            for (var i = 0; i < 7; i++) {
                activeSheet.setStyle(1, i, style, GC.Spread.Sheets.SheetArea.colHeader);
                activeSheet.setStyle(3, i, style, GC.Spread.Sheets.SheetArea.colHeader);
            }
            // set style of column header Row 2
            var style2 = new GC.Spread.Sheets.Style();
            style2.backColor = "#edfdf4";
            for (var i = 0; i < 7; i++)
                activeSheet.setStyle(2, i, style2, GC.Spread.Sheets.SheetArea.colHeader);
            spread.resumePaint();
        });
ExcelIO
Excel does not support customizing the header area. But if the user wants to import and export the formula header in Excel, they can use the frozenColumnsAsRowHeaders or frozenRowsAsColumnHeaders and rowHeadersAsFrozenColumns or columnHeadersAsFrozenRows properties of SpreadJS. If you enable these properties, the formulas in header area will be kept. Further, these will be translated into frozen area during exporting, and translated into header area during importing.
Note : The viewport references can be referred to by the headers, but the headers' references can be referred to by itself only. But, this will not handle the range, which crosses the frozen case. Also, SparklineEx in the header area doesn't support ExcelIO.


