
- SpreadJS Overview
- Getting Started
- JavaScript Frameworks
- Best Practices
- Features
- SpreadJS Designer
- SpreadJS Designer Component
- Touch Support
-
Formula Reference
- Formula Overview
-
Formula Functions
- Barcode Functions
- Compatibility Functions
- Database Functions
- Date and Time Functions
- Engineering Functions
- Financial Functions
- Information Functions
- Logical Functions
- Lookup and Reference Functions
- Math and Trigonometric Functions
-
Statistical Functions
- AVEDEV
- AVERAGE
- AVERAGEA
- AVERAGEIF
- AVERAGEIFS
- BETA.DIST
- BETA.INV
- BINOM.DIST
- BINOM.DIST.RANGE
- BINOM.INV
- CHISQ.DIST
- CHISQ.DIST.RT
- CHISQ.INV
- CHISQ.INV.RT
- CHISQ.TEST
- CONFIDENCE.NORM
- CONFIDENCE.T
- CORREL
- COUNT
- COUNTA
- COUNTBLANK
- COUNTIF
- COUNTIFS
-
COVARIANCE.P
- COVARIANCE.S
- DEVSQ
- EXPON.DIST
- F.DIST
- F.DIST.RT
- F.INV
- F.INV.RT
- F.TEST
- FINV
- FISHER
- FISHERINV
- FORECAST
- FREQUENCY
- GAMMA
- GAMMA.DIST
- GAMMA.INV
- GAMMALN
- GAMMALN.PRECISE
- GAUSS
- GEOMEAN
- GROWTH
- HARMEAN
- HYPGEOM.DIST
- INTERCEPT
- KURT
- LARGE
- LINEST
- LOGEST
- LOGNORM.DIST
- LOGNORM.INV
- MAX
- MAXA
- MAXIFS
- MEDIAN
- MIN
- MINA
- MINIFS
- MODE.MULT
- MODE.SNGL
- NEGBINOM.DIST
- NORM.DIST
- NORM.S.DIST
- NORM.S.INV
- NORMINV
- PEARSON
- PERCENTILE.EXC
- PERCENTILE.INC
- PERCENTRANK.EXC
- PERCENTRANK.INC
- PERMUT
- PERMUTATIONA
- PHI
- POISSON.DIST
- PROB
- QUARTILE.EXC
- QUARTILE.INC
- RANK.AVG
- RANK.EQ
- RSQ
- SKEW
- SKEW.P
- SLOPE
- SMALL
- STANDARDIZE
- STDEV.P
- STDEV.S
- STDEVA
- STDEVPA
- STEYX
- T.DIST
- T.DIST.2T
- T.DIST.RT
- T.INV
- T.INV.2T
- T.TEST
- TREND
- TRIMMEAN
- VAR.P
- VAR.S
- VARA
- VARPA
- WEIBULL.DIST
- Z.TEST
- Sparkline Functions
- Text Functions
- Web Functions
- Other Functions
- RegEx Functions
- Import and Export Reference
- Frequently Used Events
- API Documentation
- Release Notes
COVARIANCE.P
This function returns the population covariance, which is the average of the products of deviations for each data point pair in two sets of numbers.
Syntax
COVARIANCE.P(array1, array2)
Arguments
The two arrays of data in the arguments of this function should meet these criteria:
The data should contain numbers, names, arrays, or references that are numeric. If some cells do not contain numeric data, they are ignored.
The data sets should be the same size, with the same number of data points.
The data sets should not be empty, nor should the standard deviation of their values equal zero.
Remarks
Use this covariance function to determine the relationship between two sets of data. For example, you can determine whether greater income accompanies greater levels of education in a population.
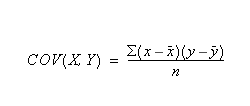
The covariance is calculated as follows, where n and y are the sample means, AVERAGE(array1) and AVERAGE(array2), and n is the sample size.
Data Types
Accepts arrays of numeric data for both arguments. Returns numeric data.
Examples
COVARIANCE.P(J2:J5,L2:L5)
COVARIANCE.P(R2C12:R15C12,R2C14:R15C14)
COVARIANCE.P({7,5,6},{7,4,4}) gives the result 1
COVARIANCE.P({5,10,15,20,25},{4,8,16,32,64}) gives the result 144