SpreadJS Overview
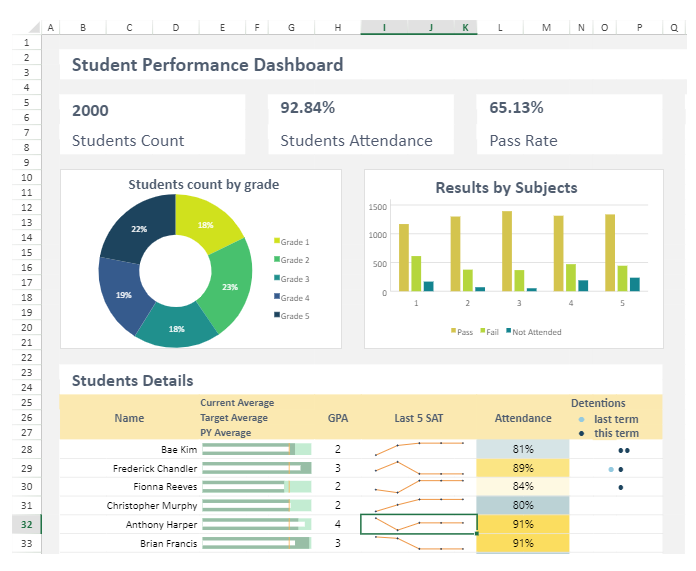
SpreadJS is a comprehensive spreadsheet solution for enterprise JavaScript development. It combines grid capabilities and spreadsheet functionality to provide a complete Excel-like experience, including tables, pivot tables, tablesheets, form controls for data input forms, charts, floating objects, shapes, namebox, slicers, sparklines, high-speed calculation engine, conditional formatting, sorting and filtering. It also offers extensive support for importing and exporting native Excel spreadsheets with zero Excel dependencies. Further, SpreadJS provides exclusive features like barcodes, rich text, cell buttons, cell dropdowns and range templates to assist developers in creating robust JavaScript applications.
The in-built Calculation Engine covers more than 500 Functions in 19 Languages. It is a function suite that comprises dynamic arrays, custom user-defined functions, and statistical and financial functions, all which are optimized for heavy calculations, big data and complex Excel models.
Not just this, you can quickly develop web applications with SpreadJS in different Frameworks such as Angular, AngularJS, React, Vue, Breeze and Knockout. You also can use the SpreadJS File Format, a file format that makes it easy to work with bulky files in JavaScript applications.

SpreadJS also provides a WYSIWYG environment to customize spreadsheets as per the user requirements, which is the designer component, SpreadJS Designer. It lets you create and manage business spreadsheets, advanced data grids, interactive dashboards, analytical charts, business intelligence reports, well-defined data entry forms and much more.
Note: Microsoft and Excel are either registered trademarks or trademarks of Microsoft Corporation in the United States and/or other countries. Other brand and product names are trademarks or registered trademarks of their respective holders.
Documentation | Blogs | Demo Samples |
|---|---|---|


