
- SpreadJS Overview
- Getting Started
- JavaScript Frameworks
- Best Practices
-
Features
- Workbook
- Worksheet
- Rows and Columns
- Headers
- Cells
- Data Binding
- TableSheet
- GanttSheet
- JSON Schema with SpreadJS
- SpreadJS File Format
- Data Validation
- Conditional Formatting
- Sort
- Group
- Formulas
- Serialization
- Keyboard Actions
- Shapes
- Form Controls
- Floating Objects
- Barcodes
- Charts
- Sparklines
- Tables
- Pivot Table
- Slicer
- Theme
- Culture
- SpreadJS Designer
- SpreadJS Designer Component
- Touch Support
- Formula Reference
- Import and Export Reference
- Frequently Used Events
- API Documentation
- Release Notes
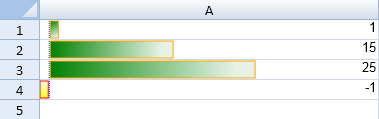
Data Bar Rule
SpreadJS supports the data bar rule. The rule uses a bar that is displayed as the background for each cell. The length of the bar corresponds to the size of the data relative to the other data in the sheet. The longer the bar, the greater the value in the cell.
You can use the addDataBarRule method to create a rule and add it to the collection. The BarDirection and DataBarAxisPosition types can be used to specify the data bar direction and axis position.
You can specify the minimum and maximum type and the value to compare in the conditional format. The minType method can be set to Number, LowestValue, HighestValue, Percent, Formula, Percentile, and Automin, or Automax.
The following code sample creates a data bar rule and uses the addRule method to add the rule.
activeSheet.setValue(0,0,1,3);
activeSheet.setValue(1,0,15,3);
activeSheet.setValue(2,0,25,3);
activeSheet.setValue(3,0,-1,3);
var dataBarRule = new GC.Spread.Sheets.ConditionalFormatting.DataBarRule(GC.Spread.Sheets.ConditionalFormatting.ScaleValueType.Number, -1, GC.Spread.Sheets.ConditionalFormatting.ScaleValueType.Number, 40, "green", [new GC.Spread.Sheets.Range(0,0,4,1)]);
dataBarRule.color("green");
dataBarRule.showBorder(true);
dataBarRule.borderColor("orange");
dataBarRule.dataBarDirection(GC.Spread.Sheets.ConditionalFormatting.BarDirection.LeftToRight);
dataBarRule.negativeFillColor("yellow");
dataBarRule.useNegativeFillColor(true);
dataBarRule.negativeBorderColor("red");
dataBarRule.useNegativeBorderColor(true);
dataBarRule.axisPosition(GC.Spread.Sheets.ConditionalFormatting.DataBarAxisPosition.Automatic);
dataBarRule.axisColor("blue");
dataBarRule.showBarOnly(false);
activeSheet.conditionalFormats.addRule(dataBarRule);