- SpreadJS Overview
- Getting Started
- JavaScript Frameworks
- Best Practices
-
Features
- Workbook
- Worksheet
- Rows and Columns
- Headers
- Cells
- Data Binding
- TableSheet
- GanttSheet
- JSON Schema with SpreadJS
- SpreadJS File Format
- Data Validation
- Conditional Formatting
- Sort
- Group
- Formulas
- Serialization
- Keyboard Actions
- Shapes
- Form Controls
- Floating Objects
- Barcodes
- Charts
- Sparklines
- Tables
- Pivot Table
- Slicer
- Theme
- Culture
- SpreadJS Designer
- SpreadJS Designer Component
- Touch Support
- Formula Reference
- Import and Export Reference
- Frequently Used Events
- API Documentation
- Release Notes
Gantt Chart Components
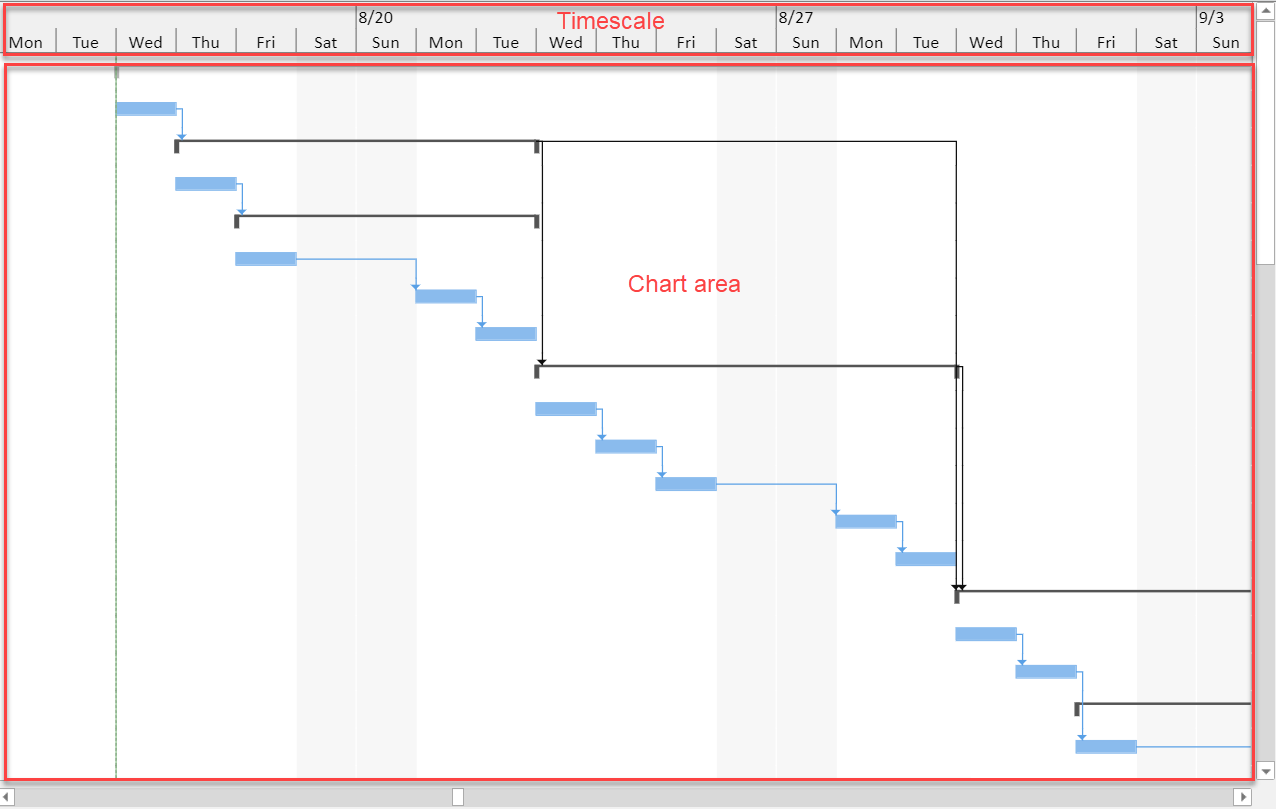
The Gantt chart is a special sheet column in GanttSheet that illustrates project schedules. It shows the start and finish dates of each task and typically adds information such as the completion state of each task and dependencies between tasks.
Gantt charts have two basic components, Timescale and Chart Area.

Timescale
Timescale represents the column header of a Gantt chart. It shows the smaller or greater time units, such as years, quarters, months, weeks, days and so on. The maximum time scale in a Gantt chart is year, and the minimum time scale is 15 minutes.
Timescale consists of three different tiers and a scale separator.
Timescale Tiers
Gantt chart has three tier modes, middle, middleBottom, and topMiddileBottom to show time scales. You can use the TimescaleTierMode enumeration to set the tier mode for the timescale.

The following code sample shows how to show the tier modes for timescale in a Gantt chart.
// Set the tier mode for the timescale.
   var timescale = ganttSheet.project.timescale;
   timescale.tierMode = GC.Spread.Sheets.GanttSheet.TimescaleTierMode.middle;
A timescale tier has the following configurable properties.
Properties | Type | Description |
|---|---|---|
unit | GC.Spread.Sheets.GanttSheet.TimescaleUnit | The unit of the tier. |
count | number | A number that represents the tick units. The default value is 1. |
labelAlign | Left/center/right | The alignment of the tick label. The default value is ‘Left’. |
showTickLines | boolean | The status of tick lines. The default value is ‘True’. |
formatter | string | Formats the tick labels for the tier. The formatter could be a Spread Number Format string for Date values like "yyyy-mm-dd", with GanttSheet special keywords support, or could be a callback function that will be executed in formatting. |
The following sample code shows how to configure the middle tier properties.
// Set the tier configuration.
var timescale = ganttSheet.project.timescale;
var targetTier = "middleTier";
timescale[targetTier].unit = GC.Spread.Sheets.GanttSheet.TimescaleUnit.days;
timescale[targetTier].count = 2;
timescale[targetTier].labelAlign = "Center";
timescale[targetTier].formatter = "dddd";
timescale[targetTier].showTickLines = false;
Timescale Separator
You can also set the showScaleSeparator option to show the separate scale line between the topMiddleButtom and middle tiers. By default, this option value is True. To hide, you need to change the value of the showScaleSeparator option to false.

The following code sample shows how to hide the scale separator line.
// Hide scale separator.
ganttSheet.project.timescale.showScaleSeparator = false;
The Gif below demonstrates the configuration of timescale appearance in a Gantt chart.

Chart Area
The chart area refers to the body part of a Gantt chart. It enables you to show working and non-working time, configure chart layout, change taskbar styles, add task summary, show gridlines, link/unlink tasks etc. You can also change the layout styles, zoom in/zoom out the Gantt chart, and scroll the timescale horizontally or vertically to get a suitable view.
For configuring the chart area and its various features, refer to the below topics:
Topic | Description |
|---|---|
Change the nonworking time style in Gantt chart. | |
Change the gridlines style in Gantt chart. | |
Change the style of the specified taskbar with the specified style rule. | |
Configure the Gantt chart layout with link line mode, taskbar height, date text format, and whether round the taskbar to whole days. | |
Zoom the Gantt chart area to the suitable view. | |
Scroll the Gantt chart area to the suitable view. |


