- SpreadJS Overview
- Getting Started
- JavaScript Frameworks
- Best Practices
-
Features
- Workbook
- Worksheet
- Rows and Columns
- Headers
- Cells
- Data Binding
- TableSheet
- GanttSheet
- JSON Schema with SpreadJS
- SpreadJS File Format
- Data Validation
- Conditional Formatting
- Sort
- Group
- Formulas
- Serialization
- Keyboard Actions
- Shapes
- Form Controls
- Floating Objects
- Barcodes
- Charts
- Sparklines
- Tables
- Pivot Table
- Slicer
- Theme
- Culture
- SpreadJS Designer
- SpreadJS Designer Component
- Touch Support
- Formula Reference
- Import and Export Reference
- Frequently Used Events
- API Documentation
- Release Notes
Pivot Table in Designer Component
Pivot tables are the easiest and most effective way to analyze complex data sets.
You can create a pivot table using SpreadJS Designer Component. It helps to organize and summarize data using built-in aggregations, pivot table field lists, and calculated fields. A pivot table is specially designed for:
Analyzing data easily: Using pivot tables, you can manage large data sets for rapid analysis. Pivot tables can group data and filter out irrelevant information to present only the data you need. Therefore, the use of pivot tables will simplify and increase the effectiveness of your data analysis tasks.
Creating data summaries: Sometimes, it is a difficult task to find specific data manually within multiple rows and columns to perform Excel calculations. In this scenario, pivot tables let you arrange, label, and sort the rows and columns according to your needs. Pivot tables are also useful in organizing relevant information for creating accurate and meaningful reports easily.
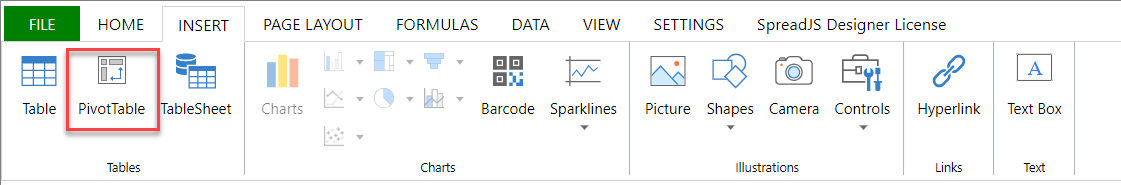
In the SpreadJS Designer Component, the PivotTable button is available inside the INSERT > Tables tab group.
You can create a pivot table in the SpreadJS Designer Component using the following steps.
Purchase a valid PivotTable add-on license.
Note: The PivotTable is a separate deployment add-on package in SpreadJS. To deploy this feature, you should have a valid SpreadJS license along with the PivotTable add-on license. For more information, please refer to SpreadJS Designer Component and PivotTable Add-on and SpreadJS Pricing and Licensing pages.
Use the SpreadJS Designer Component in your project with a new or existing spreadsheet by following the steps mentioned on the Quick Start page.
Add the following additional script file to use the PivotTable feature.
<script src="scripts/gc.spread.pivot.pivottables.x.x.x.min.js" type="text/javascript"></script>Run the application and now you can create a pivot table using the SpreadJS Designer Component.
To create a pivot table, import or create the datasource, as per your requirement.
Go to the INSERT tab and click on the PivotTable button.
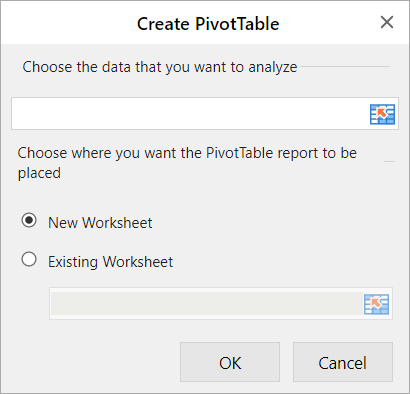
Select the data that you want to analyze using a pivot table and select either New Worksheet or Existing Worksheet. In the case of Existing Worksheet, select the range where you want the pivot table to appear and click OK.
Click on the PivotTable area to work with the pivot table. This will open the pivot panel.
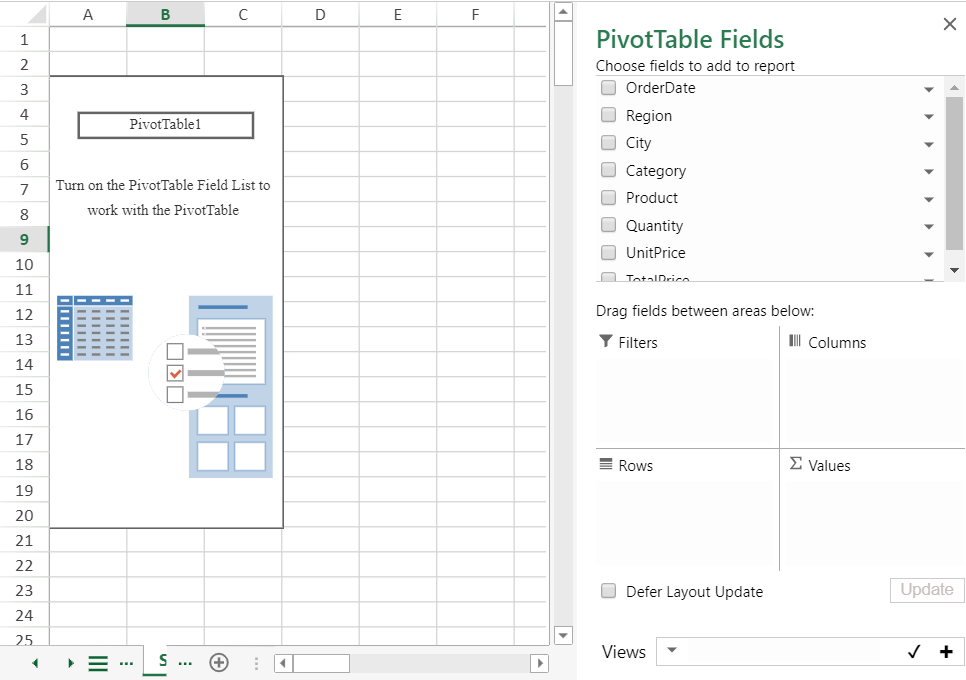
Use the pivot panel to add, remove, drag, and move fields in a pivot table as per your requirement. For more information, see Pivot Table.
The following GIF illustrates the steps to create a pivot table.