
- SpreadJS Overview
- Getting Started
- JavaScript Frameworks
- Best Practices
-
Features
- Workbook
- Worksheet
- Rows and Columns
- Headers
- Cells
- Data Binding
- TableSheet
- GanttSheet
- JSON Schema with SpreadJS
- SpreadJS File Format
- Data Validation
- Conditional Formatting
- Sort
- Group
- Formulas
- Serialization
- Keyboard Actions
- Shapes
- Form Controls
- Floating Objects
- Barcodes
- Charts
- Sparklines
- Tables
- Pivot Table
- Slicer
- Theme
- Culture
- SpreadJS Designer
- SpreadJS Designer Component
- Touch Support
- Formula Reference
- Import and Export Reference
- Frequently Used Events
- API Documentation
- Release Notes
Themes and Style
SpreadJS allows you to apply themes and styles over the pivot table to change its appearance.
Themes
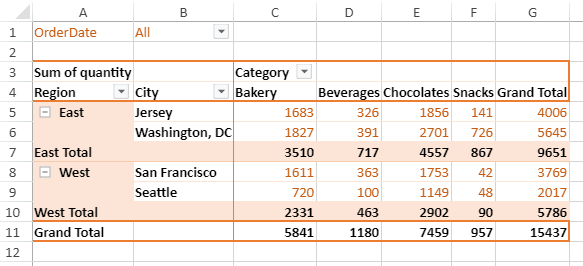
SpreadJS provides 29 light, 28 medium, and 28 dark predefined themes which can be applied to a pivot table. The following image shows the light10 theme:
You can change the theme of a pivot table in one of the following ways:
Set the theme while adding a pivot table to the spreadsheet. Refer to the following sample code.
var myPivotTable = sheet.pivotTables.add("myPivotTable", "tableSales", 1, 1, GC.Spread.Pivot.PivotTableLayoutType.outline, GC.Spread.Pivot.PivotTableThemes.light10);Set the theme by using
themeoption shown below.myPivotTable.theme(GC.Spread.Pivot.PivotTableThemes.light10);
Style
You can apply a pivot table style to highlight any specific data. The style method can be used to apply styles to row and column fields. The following image shows the style for column fields of a pivot table.
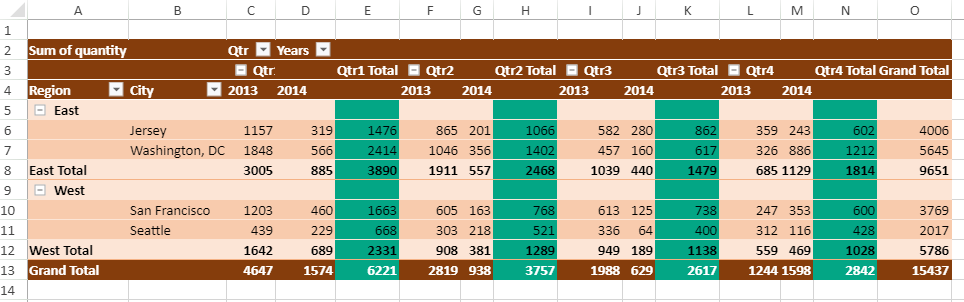
The following code sample shows how to apply style for column fields.
function setMarkSubtotalPivotTableStyle(pivotTable) {
    // create style to mark Qtr Total's in specific color
    let style = new GC.Spread.Sheets.Style();
    style.backColor = "#03A685";
    let subtotalLabelPivotArea = {
        labelOnly: true,
        references: [{
            fieldName: "Qt",
            subtotal: true,
            items: ["Qtr1", "Qtr2", "Qtr3", "Qtr4"]
        }]
    };
    // set style to mark Qtr Total's in specific color
    pivotTable.setStyle(subtotalLabelPivotArea, style);
    let subtotalDataPivotArea = {
        dataOnly: true,
        references: [{
            fieldName: "Qtr",
            subtotal: true,
            items: ["Qtr1", "Qtr2", "Qtr3", "Qtr4"]
        }]
    };
    pivotTable.setStyle(subtotalDataPivotArea, style);
}
The following image shows the style for row fields of a pivot table.
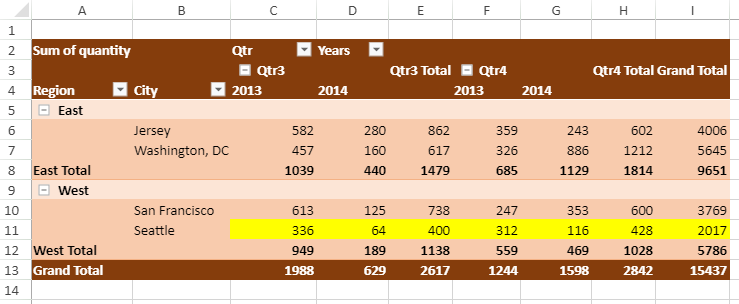
The following code sample shows how to apply style for row fields.
function setMarkSeattlePivotTableStyle(pivotTable) {
    // create and set style to mark row with "Seattle" City
    let seattlePivotArea = {
        references: [{
            fieldName: "City",
            items: ["Seattle"],
            applyLabel: true,
            applyData: true,
            applyGrandTotal: true,
            applySubtotal: true
        }]
    };
    let style = new GC.Spread.Sheets.Style();
    style.backColor = "yellow";
    pivotTable.setStyle(seattlePivotArea, style);
}