
차트 주석
주석은 차트에서 주목할 만한 포인트 또는 영역을 강조 표시하는 데 사용됩니다. 주석을 사용하여 이미지, 모양 및 텍스트와 같은 임의의 요소를 차트에 배치할 수도 있습니다. FlexChart 컨트롤은 직사각형, 사각형, 원, 타원, 선, 다각형, 이미지, 텍스트와 같은 다양한 기본 제공 주석을 지원합니다.
주석은 특정 데이터 포인트에 부착되거나 데이터 또는 페이지 좌표의 임의 포인트에 부착될 수 있습니다.
다음 단계에 따라 FlexChart에 주석을 추가하실 수 있습니다:
차트에 부착된 __AnnotationLayer__를 만듭니다.
타원, 직사각형, 이미지 또는 텍스트와 같은 주석 객체로 채웁니다.
각 주석의 attachment 속성을 설정하여 차트에 첨부하는 방법을 결정합니다.
주석이 포인트에 연결된 경우, __pointIndex__와 __seriesIndex__와 같은 주석에 대한 추가 속성을 설정합니다.
예시:
import * as wjChart from '@mescius/wijmo.chart';
import * as wjAnnotation from '@mescius/wijmo.chart.annotation';

// add annotation layer
var annotations = new wjAnnotation.AnnotationLayer(myChart);
// attach Ellipse annotation to data point 5
annotations.items.push({
    type: 'Ellipse',
    content: 'Ellipse',
    tooltip: 'This is an <b>Ellipse</b><br/>annotation',
    attachment: 'DataIndex',
    seriesIndex: 0,
    pointIndex: 5,
    width: 100,
    height: 40,
    position: 'Top',
    style: {
        fill: 'green',
        stroke: 'darkgreen',
        strokeWidth: 2,
        opacity: .25
        }
	}
);
주석 컬렉션은 AnnotationLayer 생성자에게 매개 변수로 전달될 수도 있습니다.
Annotation Types
FlexChart는 다음과 같은 기본 제공 유형의 주석을 지원합니다.
Circle: 원 주석을 나타냅니다. radius 속성을 설정하여 크기를 설정합니다.
Ellipse: 타원 주석을 나타냅니다. height 와 width 속성으로 크기를 설정합니다.
Image: 이미지 주석을 나타냅니다. href, height ,width 속성을 설정하여 이미지를 구성합니다.
Line: 선 주석을 나타냅니다. end 와 start 포인트 속성을 설정하여 선을 구성합니다.
Polygon: 폴리곤(Polygon) 주석을 나타냅니다. points 속성을 설정하여 다각형 모양을 구성합니다.
Rectangle: 직사각형 주석을 나타냅니다. height 및 width 속성으로 크기를 설정합니다.
Square: 정사각형 주석을 나타냅니다. length 속성으로 크기를 설정합니다.
Text: 텍스트 주석을 나타냅니다. text 속성으로 텍스트를 설정합니다.
선 주석 예시:
// show a trendline between Jan 31 and Feb 27
annotations.items.push({
    type: 'Line',
    tooltip: 'This is a <b>Line</b><br/>annotation',
    position: 'Center',
    attachment: 'DataCoordinate',
    start: { x: new Date(2017, 0, 31), y: 810 },
    end: { x: new Date(2017, 1, 28), y: 840 },
    style: {
        stroke: 'darkgreen',
        strokeWidth: 4,
        opacity: .5 }
    }
);
이미지 주석 예시:
// show a map marker image
annotations.items.push({
    type: 'Image',
    href: 'https://maps.google.com/mapfiles/marker_green.png',
    width: 15,
    height: 30,
    attachment: 'DataCoordinate',
    point: { x: new Date(2017, 1, 7), y: 800},
    tooltip: 'Time to buy!',
  	}
);
모든 주석에는 다음과 같은 공통 속성이 있습니다:
attachment: 첨부 기술. 자세한 내용은 다음 항목을 참조하시길 바랍니다.
isVisible: 주석의 가시성(true/false).
name: 주석의 이름
offset: 첨부 포인트(attachment point)에서 주석의 오프셋(포인트)입니다.
point: DataCoordinate과 Absolute 첨부 기술에 대한 주석의 좌표점입니다.
pointIndex: 데이터 포인트 인덱스. attachment 속성이 DataIndex로 설정된 경우에만 적용됩니다.
position: 첨부 포인트를 기준으로 한 주석의 위치.(중앙/상단/하단/왼쪽/오른쪽).
seriesIndex: 주석의 데이터 계열(Series) 인덱스. attachment 속성이 DataIndex로 설정된 경우에만 적용됩니다.
style: 채우기, 스트로크, 스트로크 폭 등을 포함하여 SVG 스타일링 속성을 지정하는 스타일 속성.
tooltip: 주석의 툴팁 문자열입니다.
주석 첨부(Annotation Attachments)
FlexChart 주석은 다음과 같은 첨부 기술을 지원합니다.
DataIndex: 주석 포인트의 좌표는 데이터 시리즈 인덱스와 데이터 포인트 인덱스에 의해 정의됩니다.
DataCoordinate: 주석 포인트는 데이터 좌표에 지정됩니다.
Relative: 주석 포인트는 컨트롤 내부의 상대적 위치로 지정되며, 여기서 (0,0)은 왼쪽 상단 모서리이고 (1,1)은 오른쪽 하단 모서리입니다.
Absolute: 주석 포인트는 컨트롤의 픽셀 좌표에 지정됩니다.
데이터 포인트에 주석 첨부(Annotation Attachments)
다음 단계에 따라 특정 데이터 포인트에 주석을 첨부하실 수 있습니다:
attachment 속성을 DataIndex로 설정합니다.
__seriesIndex__를 첨부된 계열(Series)의 인덱스로 설정합니다. 차트에 계열(Series)이 하나만 있는 경우 이 값을 0으로 설정해야 합니다.
__pointIndex__를 첨부된 계열(Series) 내 데이터 포인트의 인덱스로 설정합니다.
추가 속성을 설정하여 모양을 구성합니다.
예시:
// attach annotation to the 5th data point in first series
annotations.items.push({
    type: 'Text',
    attachment: 'DataIndex',
    seriesIndex: 0,
    pointIndex: 5,
    text: 'Annotation'
  	}
);
데이터 좌표로 주석 첨부(Annotation Attachments)
다음 단계를 수행하여 플롯 좌표계의 어느 곳에나 주석을 부착할 수 있습니다:
attachment 속성을 DataCoordinate로 설정합니다.
좌표를 플롯할 __point__를 설정합니다.
추가 속성을 설정하여 모양을 구성합니다.
예시:
// attach annotation at x: 10, y: 80
annotations.items.push({
    type: 'Text',
    attachment: 'DataCoordinate',
    point: { x: 10, y: 80},
    text: 'Annotation'
  	}
);
직사각형 주석을 사용하여 영역 생성
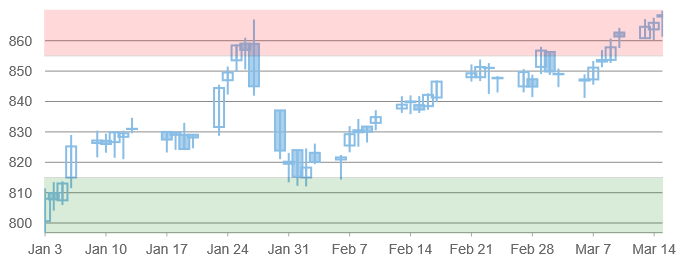
주석을 사용하여 차트 영역을 만들 수 있습니다. 영역은 값 범위를 강조 표시하는 데 사용되는 데이터 포인트 뒤에 있는 플롯 영역의 색상 영역입니다.
예를 들어, 아래 차트에는 녹색과 빨간색 직사각형 주석이 표시된 'buy' 와 'sell' 영역이 있습니다:
// add annotation layer with two rectangle annotations
var annotations = new wjAnnotation.AnnotationLayer(myChart, [
    {
        type: 'Rectangle',
        attachment: 'DataCoordinate',
        point: { x: new Date(2017, 0, 1), y: 855},
        position: 1, // Center Top Bottom Left Right
        width: 20000, height: 20000,
        style: { fill: 'red', opacity: .15 }
  	},
	{
    	type: 'Rectangle',
        attachment: 'DataCoordinate',
        point: { x: new Date(2017, 0, 1), y: 815},
        position: 2, // Center Top Bottom Left Right
        width: 20000, height: 20000,
        style: { fill: 'green', opacity: .15 }
  	}
  ]);
데이터 좌표 첨부 파일과 함께 사용할 경우 폴리곤(Polygon) 주석을 통해 모든 모서리 주위에 플롯 경계포인트가 있는 영역을 만들 수 있습니다. 아래 예시는 절대 위치결정된 폴리곤 주석을 보여줍니다.
// add annotation layer with polygon annotation
var annotations = new wjAnnotation.AnnotationLayer(myChart, [
  {
    type: "Polygon",
    content: "Absolute",
    position: 0,
    style: {
      fill: "#FE2E2E",
      stroke: "#01A9DB",
      fill-opacity: 2,
      stroke-width: 4,
      stroke-opacity: 1
    },
    points: [
      { "x": 200, "y": 0 },
      { "x": 150, "y": 50 },
      { "x": 175, "y": 100 },
      { "x": 225, "y": 100 },
      { "x": 250, "y": 50 }
    ]
  }
]);