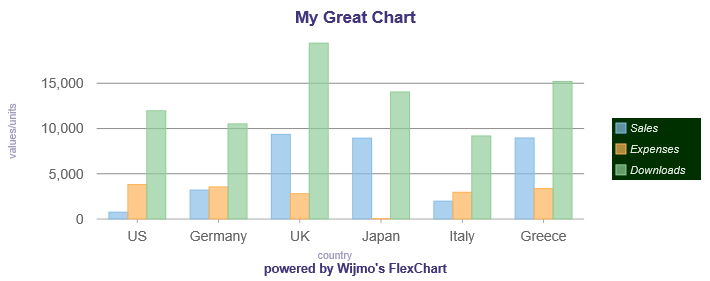
범례 및 제목
범례 제목 & 위치 설정
legend의 속성을 사용하여 차트 범례의 모양을 사용자 정의합니다.
position: 플롯 영역을 기준으로 범례의 표시 여부와 위치를 결정합니다. 값은 'TopLeft', 'TopRight', 'BottomLeft', 'BottomRight', 'LeftTop', 'LeftBottom', 'RightTop', 'RightBottom', 'Left', 'Right', 'Top', 'Bottom' 또는 'None'일 수 있습니다.
title: 범례의 제목 텍스트.
titleAlign: 범례 제목의 정렬 값을 결정합니다. 값은 '왼쪽', '중앙' 또는 '오른쪽'이어야 합니다.
범례를 숨기려면 해당 position을 'None'으로 설정합니다.
머리글, 바닥글 & 축 제목 설정
머리글, 바닥글 및 축 제목을 설정하여 차트에 일부 텍스트 레이블을 추가합니다.
import * as chart from '@mescius/wijmo.chart';

var myChart = new chart.FlexChart('#myChart');
myChart.header = 'Sample Chart';
myChart.footer = 'copyright (c) ComponentOne';
myChart.axisX.title = 'country';
myChart.axisY.title = 'amount';
CSS로 범례 & 제목 스타일 지정
CSS를 사용하여 범례와 제목의 스타일을 지정할 수 있습니다. 아래 CSS 예시는 범례와 제목의 모양을 사용자 정의하는 데 사용되는 규칙을 보여줍니다. 이러한 요소는 SVG 요소이므로 "color" 대신 "fill"과 같은 CSS 속성을 사용해야 합니다.
머리글, 바닥글 & 축 제목 예제:
/* custom color for all titles */
.wj-flexchart .wj-title {
  fill: #42357C;
}

/* custom size/weight for header */
.wj-flexchart .wj-header .wj-title {
  font-size: 120%;
  font-weight: bold;
}

/* custom size/weight for footer */
.wj-flexchart .wj-footer .wj-title {
  font-size: 90%;
  font-weight: bold;
}

/* custom style for axis-x/y titles */
.wj-flexchart .wj-axis-x .wj-title,
.wj-flexchart .wj-axis-y .wj-title{
  font-size: 75%;
  font-style: normal;
  opacity: .5;
}
범례 예시:
/* custom color for legend box */
.wj-flexchart .wj-legend > rect {
  fill: #003000;
}

/* custom color for legend labels */
.wj-flexchart .wj-legend .wj-label {
  fill: white;
  opacity: .9;
  font-size: 80%;
  font-style: italic;
}


