- SpreadJS Overview
- Getting Started
- JavaScript Frameworks
- Best Practices
-
Features
- Workbook
- Worksheet
- Rows and Columns
- Headers
- Cells
- Data Binding
- TableSheet
- GanttSheet
- JSON Schema with SpreadJS
- SpreadJS File Format
- Data Validation
- Conditional Formatting
- Sort
- Group
- Formulas
- Serialization
- Keyboard Actions
- Shapes
- Form Controls
- Floating Objects
- Barcodes
- Charts
- Sparklines
- Tables
- Pivot Table
- Slicer
- Theme
- Culture
- SpreadJS Designer
- SpreadJS Designer Component
- Touch Support
- Formula Reference
- Import and Export Reference
- Frequently Used Events
- API Documentation
- Release Notes
Pivot Table Item Slicer
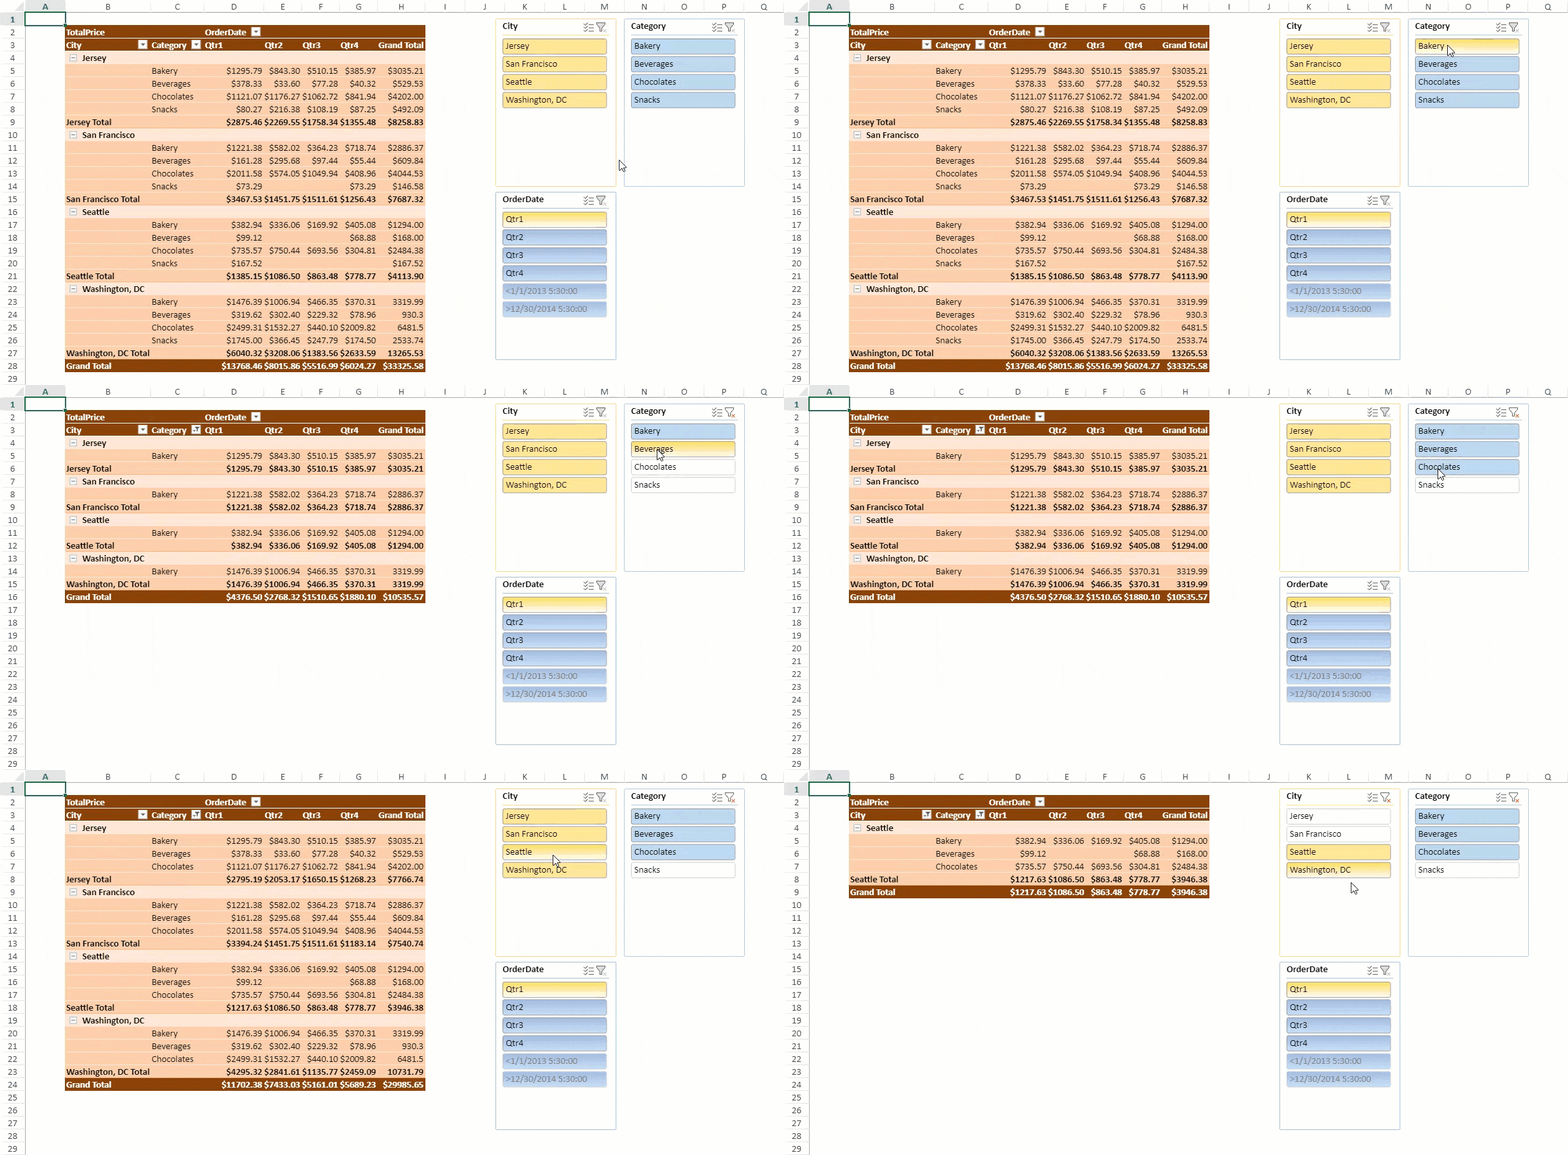
SpreadJS provides a Pivot Table Item Slicer that enables filtering a pivot table with a single click. You can filter an aggregate target by connecting multiple pivot tables using a slicer. It can filter a pivot table's data using manual filters. It offers a user-friendly interface, enabling you to manage the filter state of row and column fields of your pivot table efficiently.
The PivotTableItemSlicer class provides various slicer-related methods to work with the pivot table slicer.

The following code sample shows how to add a pivot table slicer using the SlicerCollection.add method. The SlicerType should be set to pivotTable.
$(document).ready(function () {
    // initializing Spread
    spread = new GC.Spread.Sheets.Workbook(document.getElementById('ss'), { sheetCount: 2 });
    spread.options.allowDynamicArray = true;
    spread.suspendPaint();
    // get sheets
    pivotLayoutSheet = spread.getSheet(0);
    dataSourceSheet = spread.getSheet(1);

    // Hide gridlines
    pivotLayoutSheet.options.gridline = { showVerticalGridline: false, showHorizontalGridline: false };

    // set sheet name
    pivotLayoutSheet.name("PivotLayout");
    dataSourceSheet.name("DataSource");
    // set row count
    dataSourceSheet.setRowCount(245);
    // set datasource
    dataSourceSheet.setArray(0, 0, pivotDB_UseCase);
    // add table to dataSourceSheet
    dataSourceSheet.tables.add('tableSales', 0, 0, 245, 8);

    // initialize pivottable
    var pt = initPivotTable(pivotLayoutSheet);
    pivotLayoutSheet.setColumnCount(200);
    initSlicer(pivotLayoutSheet, pt);

    // auto fit columns in both the sheets
    autoFit(pivotLayoutSheet);
    autoFit(dataSourceSheet);
    spread.resumePaint();
});

function initPivotTable(sheet) {
    myPivotTable = sheet.pivotTables.add("pivotTable", "tableSales", 1, 1, GC.Spread.Pivot.PivotTableLayoutType.outline, GC.Spread.Pivot.PivotTableThemes.dark3);
    myPivotTable.suspendLayout();
    myPivotTable.add("City", "City", GC.Spread.Pivot.PivotTableFieldType.rowField);
    myPivotTable.add("Category", "Category", GC.Spread.Pivot.PivotTableFieldType.rowField);

    myPivotTable.add("OrderDate", "OrderDate", GC.Spread.Pivot.PivotTableFieldType.columnField);
    let groupInfo = {
        originFieldName: "OrderDate",
        dateGroups: [
            {
                by: GC.Pivot.DateGroupType.quarters
            }
        ]
    };
    myPivotTable.group(groupInfo);
    myPivotTable.add("TotalPrice", "TotalPrice", GC.Spread.Pivot.PivotTableFieldType.valueField, GC.Pivot.SubtotalType.sum);
    formatValueField(myPivotTable);
    myPivotTable.resumeLayout();
    myPivotTable.autoFitColumn();
    return myPivotTable;
}

function initSlicer(sheet, pt) {
    slicer_City = sheet.slicers.add("slicer_City", pt.name(), "City", GC.Spread.Sheets.Slicers.SlicerStyles.light4(), GC.Spread.Sheets.Slicers.SlicerType.pivotTable);
    slicer_City.position(new GC.Spread.Sheets.Point(1020, 10));
    slicer_Category = sheet.slicers.add("slicer_Category", pt.name(), "Category", GC.Spread.Sheets.Slicers.SlicerStyles.light1(), GC.Spread.Sheets.Slicers.SlicerType.pivotTable)
    slicer_Category.position(new GC.Spread.Sheets.Point(1220, 10));
    slicer_Date = sheet.slicers.add("slicer_Date", pt.name(), "OrderDate", GC.Spread.Sheets.Slicers.SlicerStyles.other2(), GC.Spread.Sheets.Slicers.SlicerType.pivotTable);
    slicer_Date.position(new GC.Spread.Sheets.Point(1020, 280));
}
Sort Items in Slicer
You can sort items in a pivot table slicer along with filtering. The following options are available in the Slicer settings dialog box:
Source Name: Specifies the name of the Slicer
Header:
Display Header CheckBox: Check if you want to display the name of the slicer on the header.
Caption: Name of the slicer you want to display on the header.
Sort State: Refers to the check bullets for Ascending/Descending order.
No Data Items Show: Refers to options below:
Hide items with no data: When true, it does not show the items with no data in the slicer.
Show items with no data last: If True, it shows the items with no data last. If false, items are sorted by the sort state.
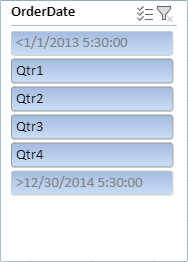
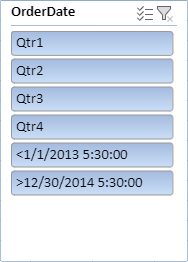
For example, Order dates like <1/1/2013 5:30:00 and >12/30/2014 5:30:00 are sorted by the sort state.

Visually indicate items with NoData: If true, it shows the items with no data as grayed out. When false, the items with no data are displayed in the same way as data items.
For example: When order dates like <1/1/2013 5:30:00 and >12/30/2014 5:30:00 do not include any data, they are still shown in the list.

Default Sort values are "Hide items with no data" and "Show Items with no data last". The slicer items are divided into two parts and each part is sorted in the ascending or descending order.
The following code sample defines different sorting or filtering functions.
function setMultiSelectFalseForSlicerCity() {
    // set MultiSelect to True
    slicer_City.multiSelect(true);
}
function setSortStateForSlicerCity() {
    // set sort state to descending
    slicer_City.sortState(GC.Spread.Sheets.SortState.descending);
}

function showNoDataItem() {
    myPivotTable.updateSource();
    // to check this delete City "Jersey"( or any one city from DataSource and click this button- on clicking this button, PT will be updated first)
    slicer_City.showNoDataItems(false);
}

function visuallyNoDataItems() {
    myPivotTable.updateSource();
    slicer_Date.visuallyNoDataItems(false);
}
function showNoDataItemsInLast() {
    slicer_Date.showNoDataItemsInLast(false);
}
Slicer and Pivot Table Connection
You can establish a connection between a slicer and the pivot table using the PivotTableItemSlicer.connectPivotTable method. The connection is controlled by either side as both the slicer and pivot table can connect or disconnect from one another. If the slicer disconnects from the pivot table, its filter action does not affect the pivot table and the same follows in the slicer.
The following code sample shows how to disconnect a connection.
function disconnectSlicerWithPivotTable() {
    // slicer_Date disconnect with PivotTable.
    slicer_Date.disconnectPivotTable(myPivotTable.name());
    slicer_Date.captionName("Disconnected");
}

