- SpreadJS Overview
- Getting Started
- JavaScript Frameworks
- Best Practices
-
Features
- Workbook
- Worksheet
- Rows and Columns
- Headers
- Cells
- Data Binding
- TableSheet
- GanttSheet
- JSON Schema with SpreadJS
- SpreadJS File Format
- Data Validation
- Conditional Formatting
- Sort
- Group
- Formulas
- Serialization
- Keyboard Actions
- Shapes
- Form Controls
- Floating Objects
- Barcodes
- Charts
- Sparklines
- Tables
- Pivot Table
- Slicer
- Theme
- Culture
- SpreadJS Designer
- SpreadJS Designer Component
- Touch Support
- Formula Reference
- Import and Export Reference
- Frequently Used Events
- API Documentation
- Release Notes
Grouping
TableSheet supports grouping the data source by the specified fields, that is, merging the same cell contents in a single cell automatically. The grouped columns are placed left to the base columns, and they consist of the following types of columns:
Base column: Contains the original column value.
Summary column: Contains aggregate results calculated by a user-defined formula.
Slicer column: Contains the slices of the aggregate results.
The following image shows the different types of columns in tablesheet grouping.

You can use the TableSheet class methods groupBy and removeGroupBy to add and remove grouping respectively. The following code sample shows how to add grouped columns including summary columns and slicer columns.
function grouping() {
    //Create groupBy by single field (Selling package), with summary fields and slice fields
    sheet.groupBy([
        {
            caption: "Selling Package", field: "sellingPackage", width: 150, style: { backColor: "#F9CA9A" },
            summaryFields: [
                {
                    caption: "SUM(Unit Price)",
                    formula: "=SUM([unitPrice])",
                    slice: { field: "=YEAR([@validFrom])", width: 120, style: { backColor: "#FCE3CA", formatter: "#,##0.00" } },
                    width: 150,
                    style: { backColor: "#FAD7B2", formatter: "#,##0.00" }
                }
            ]
        }
    ]);
}
Group Outlines
TableSheet grouping provides outlines that can be used to expand or collapse the group entry along with its related base column content.
By default, the group outline is placed in the column header along with the viewport. You can also configure it to show in the row header area, or both row header and column header, or you can hide the group outline altogether. The GroupOutlinePosition enumeration options can be used to set the position of the outline or to hide it.

The following code sample shows how to set the group outline in the row header or hide it as shown in the above GIF.
function grpOutlinePosition() {
    // set GroupOutlinePosition to rowHeader
    sheet.groupOutlinePosition(GC.Spread.Sheets.TableSheet.GroupOutlinePosition.rowHeader);
}

function grpOutlineHide() {
    // set GroupOutlinePostion to hide
    sheet.groupOutlinePosition(GC.Spread.Sheets.TableSheet.GroupOutlinePosition.none);
}
You can also hide the base columns after grouping altogether by setting the boolean parameter of the detailColumnsVisible method to false.

function detailColumnVisible() {
    // hide detail columns
    sheet.detailColumnsVisible(false);
}
Multiple Grouping
TableSheet supports multiple grouping where more than one field can be defined in the groupBy method to create a multi-level grouping.

The following code sample shows how to set multiple groupings in a tablesheet view.
function grpByMultipleFields() {
    // group by "sellingPackage" field first and then group by date in quarters of available years using DATEPART formula
    sheet.groupBy([
        { caption: "Selling Package", field: "sellingPackage", width: 150, style: { backColor: "#FAD7B2" } },
        { caption: "Year Quarter", field: `=DATEPART([@validFrom],"yyyyQQQ")`, width: 150, style: { backColor: "#FCE3CA" } }
    ]);
}
Behavior of Multiple Grouping
When applying multiple grouping in a tablesheet, the layout takes more spaces by default. The following behavior of multiple grouping can help show the grouping result in a better way.
When a grouping is collapsed, the cells of detail columns will display empty.

When a parent grouping is collapsed, the cells of the child group will also display empty.

You can set the expand or collapse state of multiple grouping using the expandGroup and expandGroupItem methods as well.
Sorting in Grouping
TableSheet supports sorting in a grouping that works between the group columns and the base columns.
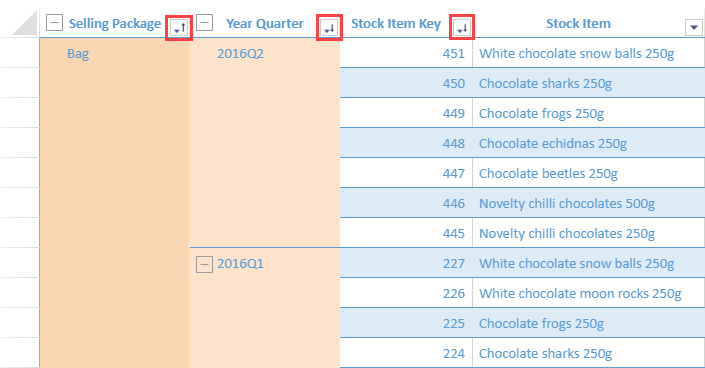
The following image shows that sort results are based on the grouping results, where the “Selling Package” group column is in ascending order whereas the “Year Quarter” group column and “Stock Item Key” base column are in descending order.

The following behavior is observed when using sorting in tablesheet grouping.
The sort status is shared between the source of the group column and itself.

Only one column can be sorted at a group level.

The last sorting status before applying
groupByand after applyingremoveGroupBymethods are retained.


