- SpreadJS Overview
- Getting Started
- JavaScript Frameworks
- Best Practices
-
Features
- Workbook
- Worksheet
- Rows and Columns
- Headers
- Cells
- Data Binding
- TableSheet
- GanttSheet
- JSON Schema with SpreadJS
- SpreadJS File Format
- Data Validation
- Conditional Formatting
- Sort
- Group
- Formulas
- Serialization
- Keyboard Actions
- Shapes
- Form Controls
- Floating Objects
- Barcodes
- Charts
-
Sparklines
- Column, Line, and Winloss Sparklines with Methods
- Markers and Points
- Horizontal and Vertical Axes
- Column, Line, and Winloss Sparklines with Formulas
- Area Sparkline
- Pie Sparkline
- Scatter Sparkline
- Bullet Sparkline
- Spread Sparkline
- Stacked Sparkline
- Hbar Sparkline
- Vbar Sparkline
- Box Plot Sparkline
- Vari Sparkline
- Cascade Sparkline
- Pareto Sparkline
- Month Sparkline
- Year Sparkline
- Custom Sparkline
- Rangeblock Sparkline
- Image Sparkline
- Histogram Sparkline
- Gauge KPI Sparkline
- Tables
- Pivot Table
- Slicer
- Theme
- Culture
- SpreadJS Designer
- SpreadJS Designer Component
- Touch Support
- Formula Reference
- Import and Export Reference
- Frequently Used Events
- API Documentation
- Release Notes
Column, Line, and Winloss Sparklines with Methods
You can create column, line, and winloss sparklines in SpreadJS using the setSparkline method. It accepts different parameters such as the location of the cell, sparkline type, sparkline settings, and the type of data range.
Two types of data ranges can be used to create a column, line, and winloss sparkline using methods - continuous and non-continuous cell ranges.
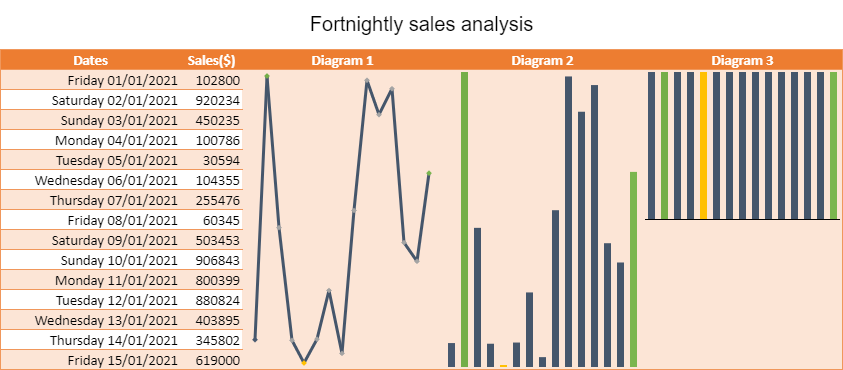
Sparklines with Continuous Ranges
The setSparkline method accepts the dataRange parameter where you can provide data ranges. For example, A1:B10, D12:E20.
The following image shows the unit sales of a car parts company throughout a fortnight. The data is supported visually by the column, line, and winloss sparklines.
spread = new GC.Spread.Sheets.Workbook(document.getElementById('ss'), { sheetCount: 1 });
var activeSheet = spread.getActiveSheet();
// set data
activeSheet.addSpan(0, 0, 1, 5);
activeSheet.getCell(0, 0, GC.Spread.Sheets.SheetArea.viewport).value("Fortnightly sales analysis").font("20px Arial").hAlign(GC.Spread.Sheets.HorizontalAlign.center).vAlign(GC.Spread.Sheets.VerticalAlign.center);
var table1 = activeSheet.tables.add("table1", 1, 0, 16, 5, GC.Spread.Sheets.Tables.TableThemes.medium3);
table1.filterButtonVisible(false);
activeSheet.setValue(1, 0, "Dates");
activeSheet.setValue(1, 1, "Sales($)");
activeSheet.setValue(1, 2, "Diagram 1");
activeSheet.setValue(1, 3, "Diagram 2");
activeSheet.setValue(1, 4, "Diagram 3");
activeSheet.getRange("A2:E2").hAlign(GC.Spread.Sheets.HorizontalAlign.center);
// set date
var now = new Date();
var daysOfYear = [];
for (var d = new Date(2021, 0, -1); d <= now; d.setDate(d.getDate() + 1)) {
daysOfYear.push(new Date(d));
}
for (var i = 2; i < 17; i++) {
activeSheet.setValue(i, 0, daysOfYear[i]);
}
// set values
activeSheet.getRange(-1, 0, -1, 1).formatter("dddd dd/mm/yyyy");
activeSheet.setValue(2, 1, 102800);
activeSheet.setValue(3, 1, 920234);
activeSheet.setValue(4, 1, 450235);
activeSheet.setValue(5, 1, 100786);
activeSheet.setValue(6, 1, 30594);
activeSheet.setValue(7, 1, 104355);
activeSheet.setValue(8, 1, 255476);
activeSheet.setValue(9, 1, 60345);
activeSheet.setValue(10, 1, 503453);
activeSheet.setValue(11, 1, 906843);
activeSheet.setValue(12, 1, 800399);
activeSheet.setValue(13, 1, 880824);
activeSheet.setValue(14, 1, 403895);
activeSheet.setValue(15, 1, 345802);
activeSheet.setValue(16, 1, 619000);
var data = new GC.Spread.Sheets.Range(2, 1, 15, 1);
// add setting for sparkline to be created
var setting = new GC.Spread.Sheets.Sparklines.SparklineSetting();
setting.options.showMarkers = true;
setting.options.lineWeight = 3;
setting.options.displayXAxis = true;
setting.options.showFirst = true;
setting.options.showLast = true;
setting.options.showLow = true;
setting.options.showHigh = true;
setting.options.showNegative = true;
setting.options.seriesColor = "Text 2 1";
setting.options.firstMarkerColor = "Text 2 3";
setting.options.negativeColor = "Accent 2 1";
setting.options.markersColor = "Accent 3 1";
setting.options.lowMarkerColor = "Accent 4 1";
setting.options.highMarkerColor = "Accent 6 1";
setting.options.lastMarkerColor = "Accent 6 6";
setting.options.axisColor = "Text 1 1";
// LINESPARKLINE
activeSheet.setSparkline(2, 2, data
, GC.Spread.Sheets.Sparklines.DataOrientation.vertical
, GC.Spread.Sheets.Sparklines.SparklineType.line
, setting
, GC.Spread.Sheets.Sparklines.DataOrientation.vertical
);
// COLUMNSPARKLINE
activeSheet.setSparkline(2, 3, data
, GC.Spread.Sheets.Sparklines.DataOrientation.vertical
, GC.Spread.Sheets.Sparklines.SparklineType.column
, setting
, GC.Spread.Sheets.Sparklines.DataOrientation.vertical
);
// WINLOSSSPARKLINE
activeSheet.setSparkline(2, 4, data
, GC.Spread.Sheets.Sparklines.DataOrientation.vertical
, GC.Spread.Sheets.Sparklines.SparklineType.winloss
, setting
, GC.Spread.Sheets.Sparklines.DataOrientation.vertical
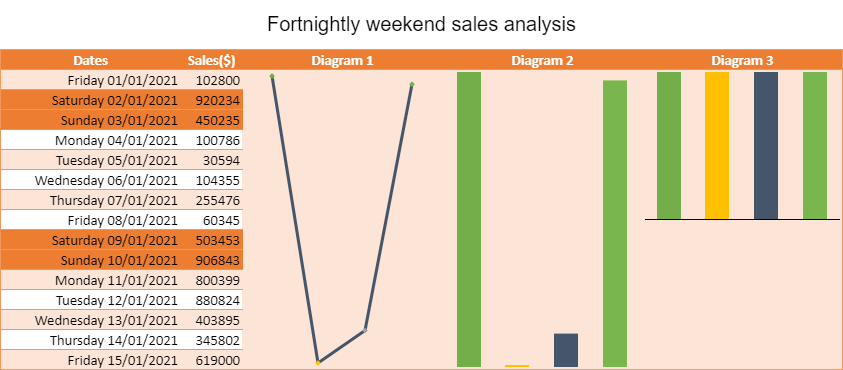
);Sparklines with Non-Continuous Ranges
You can provide non-continuous data ranges to create a sparkline where random values from a worksheet can be added to a new user-defined custom name. This custom name can be passed in the setSparkline dataRange parameter.
For example, data cells like B4, B5, B11, and B12 can be added to a custom name “range” to create a non-continuous range.
// Create a non continuous range
spread.addCustomName("range", "=Sheet1!$B$4,Sheet1!$B$5,Sheet1!$B$11,Sheet1!$B$12", 0, 0, "non-continuous range");
The following image shows the unit sales of a car parts company where specific cell values such as the weekends (Saturdays and Sundays) are chosen from a period of the fortnight to create visually supporting sparklines.