- SpreadJS Overview
- Getting Started
- JavaScript Frameworks
- Best Practices
-
Features
- Workbook
- Worksheet
- Rows and Columns
- Headers
- Cells
- Data Binding
- TableSheet
- GanttSheet
- JSON Schema with SpreadJS
- SpreadJS File Format
- Data Validation
- Conditional Formatting
- Sort
- Group
- Formulas
- Serialization
- Keyboard Actions
- Shapes
- Form Controls
- Floating Objects
- Barcodes
- Charts
-
Sparklines
- Column, Line, and Winloss Sparklines with Methods
- Markers and Points
- Horizontal and Vertical Axes
- Column, Line, and Winloss Sparklines with Formulas
- Area Sparkline
- Pie Sparkline
- Scatter Sparkline
- Bullet Sparkline
- Spread Sparkline
- Stacked Sparkline
- Hbar Sparkline
- Vbar Sparkline
- Box Plot Sparkline
- Vari Sparkline
- Cascade Sparkline
- Pareto Sparkline
- Month Sparkline
- Year Sparkline
- Custom Sparkline
- Rangeblock Sparkline
- Image Sparkline
- Histogram Sparkline
- Gauge KPI Sparkline
- Tables
- Pivot Table
- Slicer
- Theme
- Culture
- SpreadJS Designer
- SpreadJS Designer Component
- Touch Support
- Formula Reference
- Import and Export Reference
- Frequently Used Events
- API Documentation
- Release Notes
Scatter Sparkline
You can create a scatter sparkline using the SCATTERSPARKLINE formula and cell values.

The scatter sparkline formula has the following options:
Option | Description |
|---|---|
Points1 | The first XY data series. If the row count is greater than or equal to the column count, use data from the first two columns. The first column contains x-values and the second column contains y-values. If the row count is less than the column count, use data from the first two rows. The first row contains x-values and the second row contains y-values. |
Points2 | The second XY data series. If the row count is greater than or equal to the column count, use data from the first two columns. The first column contains x-values and the second column contains y-values. If the row count is less than the column count, use data from the first two rows. The first row contains x-values and the second row contains y-values. |
MinX | The x-minimum limit of both series, each series has its value if it is omitted. |
MaxX | The x-maximum limit of both series, each series has its value if it is omitted. |
MinY | The y-minimum limit of both series, each series has its value if it is omitted. |
MaxY | The y-maximum limit of both series, each series has its value if it is omitted. |
HLine | The horizontal axis position. There is no line if it is omitted. |
VLine | The vertical axis position. There is no line if it is omitted. |
XMinZone | The x-minimum value of the gray zone, there is no grey zone if any of these four parameters are omitted. |
XMaxZone | The x-maximum value of the gray zone, there is no grey zone if any of these four parameters are omitted. |
YMinZone | The y-minimum value of the gray zone, there is no grey zone if any of these four parameters are omitted. |
YMaxZone | The y-maximum value of the gray zone, there is no grey zone if any of these four parameters are omitted. |
Tags | If this option is true, mark the point at which the y-value is the maximum of the first series as "#0000FF", and mark the point at which the y-value is the minimum of the first series as "#CB0000". This option is false if it is omitted. |
DrawSymbol | If this option is true, draw each point as a symbol. The symbol of the first series is a circle, and the symbol of the second series is a square. This option is true if it is omitted. |
DrawLines | If this option is true, connect each point with a line-by sequence in each series. This option is false if it is omitted. |
Color1 | The color string of the first point series. The value is "#969696" if it is omitted. |
Color2 | The color string of the second point series. The value is "#CB0000" if it is omitted. |
Dash | If this option is true, the line is a dashed line; otherwise, the line is full. This option is false if it is omitted. |
The scatter sparkline formula has the following format:
=SCATTERSPARKLINE(points1, points2, minX, maxX, minY, maxY, hLine, vLine, xMinZone, xMaxZone, yMinZone, yMaxZone, tags, drawSymbol, drawLines, color1, color2, dash)
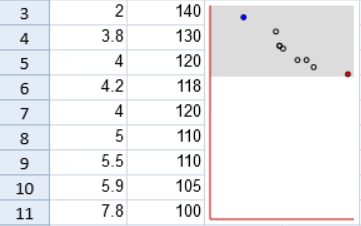
The following code sample creates a scatter sparkline.
activeSheet.setValue(2, 0, 2.0);
activeSheet.setValue(2, 1, 140);
activeSheet.setValue(3, 0, 3.8);
activeSheet.setValue(3, 1, 130);
activeSheet.setValue(4, 0, 4.0);
activeSheet.setValue(4, 1, 120);
activeSheet.setValue(5, 0, 4.2);
activeSheet.setValue(5, 1, 118);
activeSheet.setValue(6, 0, 4.0);
activeSheet.setValue(6, 1, 120);
activeSheet.setValue(7, 0, 5.0);
activeSheet.setValue(7, 1, 110);
activeSheet.setValue(8, 0, 5.5);
activeSheet.setValue(8, 1, 110);
activeSheet.setValue(9, 0, 5.9);
activeSheet.setValue(9, 1, 105);
activeSheet.setValue(10, 0, 7.8);
activeSheet.setValue(10, 1, 100);
activeSheet.addSpan(2, 2, 9, 2);
activeSheet.setFormula(2, 2, '=SCATTERSPARKLINE(A3:B11,,0,8,0,150,0,0,0,8,100,150,TRUE,TRUE,FALSE,"FD8E2C")');
activeSheet.setRowHeight(0, 50);

