- SpreadJS Overview
- Getting Started
- JavaScript Frameworks
- Best Practices
-
Features
- Workbook
- Worksheet
- Rows and Columns
- Headers
- Cells
- Data Binding
- TableSheet
- GanttSheet
- JSON Schema with SpreadJS
- SpreadJS File Format
- Data Validation
- Conditional Formatting
- Sort
- Group
- Formulas
- Serialization
- Keyboard Actions
- Shapes
- Form Controls
- Floating Objects
- Barcodes
- Charts
-
Sparklines
- Column, Line, and Winloss Sparklines with Methods
- Markers and Points
- Horizontal and Vertical Axes
- Column, Line, and Winloss Sparklines with Formulas
- Area Sparkline
- Pie Sparkline
- Scatter Sparkline
- Bullet Sparkline
- Spread Sparkline
- Stacked Sparkline
- Hbar Sparkline
- Vbar Sparkline
- Box Plot Sparkline
- Vari Sparkline
- Cascade Sparkline
- Pareto Sparkline
- Month Sparkline
- Year Sparkline
- Custom Sparkline
- Rangeblock Sparkline
- Image Sparkline
- Histogram Sparkline
- Gauge KPI Sparkline
- Tables
- Pivot Table
- Slicer
- Theme
- Culture
- SpreadJS Designer
- SpreadJS Designer Component
- Touch Support
- Formula Reference
- Import and Export Reference
- Frequently Used Events
- API Documentation
- Release Notes
Cascade Sparkline
A cascade sparkline is generally used to analyze a value over time like yearly sales, total profit, net tax, etc. It is used widely in finance, sales, legal, and construction sectors, to name a few.
Listed below are the different parameters of a CASCADESPARKLINE formula:
Option | Description |
|---|---|
pointsRange | A reference that represents the range of cells that contains values, such as "B2:B8". |
pointIndex | A number or reference that represents the index of the point. The pointIndex is >= 1 such as 1 or "D2". |
labelsRange | A reference that represents the range of cells that contains the labels, such as "A2:A8". This setting is optional. The default value is no label. |
minimum | A number or reference that represents the minimum values of the display area. This setting is optional. The default value is the minimum of the sum (the sum of the points' value), such as -2000. The minimum you set must be less than the default minimum; otherwise, the default minimum is used. |
maximum | A number or reference that represents the maximum values of the display area. This setting is optional. The default value is the maximum of the sum (the sum of the points' value), such as 6000. The maximum you set must be greater than the default maximum; otherwise, the default maximum is used. |
colorPositive | A string that represents the color of the first or last positive sparkline's box (this point's value is positive). This setting is optional. The default value is "#8CBF64". If the first or last box represents a positive value, the box's color is set to |
colorNegative | A string that represents the color of the first or last negative sparkline's box (this point's value is negative). This setting is optional. The default value is "#D6604D". If the first or last box represents the negative value, the box's color is set to |
vertical | A boolean that represents whether the box's direction is vertical or horizontal. This setting is optional. The default value is FALSE. You must set vertical to true or false for a group of formulas because all the formulas represent the entire sparkline. |
itemTypeRange | An array or reference that represents all the item types of the data range. The values should be {"-", "+", "="} or "A1:A7" that reference the value of {"+", "-", "="}, where "+" indicates positive change, "-" indicates negative change and "=" indicates total columns. This setting is optional. |
colorTotal | A string that either represents the color of the last sparkline's box when itemTypeRange does not exist or represents the color of the resulting sparkline's box when itemTypeRange exists. This setting is optional. |
Use Case Scenario
There are different use cases for Cascade sparkline on the parameters used in the CASCADESPARKLINE formula. The below section discusses two such use-cases.
Use Case 1
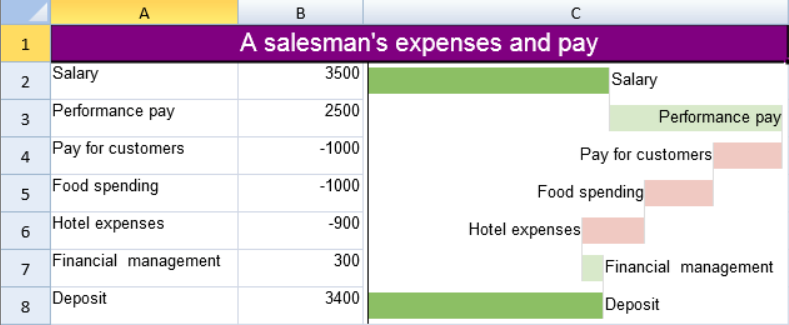
Cascade sparkline can be used to depict a “salesman’s expense and pay” using sparkline wherein the CASCADESPARKLINE formula is used with the following parameters.
= CASCADESPARKLINE(pointsRange, pointIndex, labelsRange, minimum, maximum, colorPositive, colorNegative, vertical)

The following code sample creates a cascade sparkline using the above formula in the use case.
activeSheet.addSpan(0, 0, 1, 3);
activeSheet.getCell(0, 0, GC.Spread.Sheets.SheetArea.viewport).value("A salesman's expenses and pay")
.font("20px Arial")
.hAlign(GC.Spread.Sheets.HorizontalAlign.center)
.vAlign(GC.Spread.Sheets.VerticalAlign.center)
.backColor("purple")
.foreColor("white");
activeSheet.getRange(1, 2, 7, 1, GC.Spread.Sheets.SheetArea.viewport).setBorder(new GC.Spread.Sheets.LineBorder("transparent", GC.Spread.Sheets.LineStyle.thin),
{ inside: true });
activeSheet.setValue(1, 0, "Salary");
activeSheet.setValue(2, 0, "Performance pay");
activeSheet.setValue(3, 0, "Pay for customers");
activeSheet.setValue(4, 0, "Food spending");
activeSheet.setValue(5, 0, "Hotel expenses");
activeSheet.setValue(6, 0, "Financial management");
activeSheet.setValue(7, 0, "Deposit");
activeSheet.setValue(1, 1, 3500);
activeSheet.setValue(2, 1, 2500);
activeSheet.setValue(3, 1, -1000);
activeSheet.setValue(4, 1, -1000);
activeSheet.setValue(5, 1, -900);
activeSheet.setValue(6, 1, 300);
activeSheet.setFormula(7, 1, '=sum(B2:B7)');
activeSheet.setColumnWidth(0,150);
activeSheet.setColumnWidth(1,100);
activeSheet.setColumnWidth(2, 340);
activeSheet.setRowHeight(0, 30);
activeSheet.setRowHeight(1, 30);
activeSheet.setRowHeight(2, 30);
activeSheet.setRowHeight(3, 30);
activeSheet.setRowHeight(4, 30);
activeSheet.setRowHeight(5, 30);
activeSheet.setRowHeight(6, 30);
activeSheet.setRowHeight(7, 30);
activeSheet.setFormula(1, 2, '=CASCADESPARKLINE(B2:B8,1,A2:A8,,,"#8CBF64","#D6604D",false)');
activeSheet.setFormula(2, 2, '=CASCADESPARKLINE(B2:B8,2,A2:A8,,,"#8CBF64","#D6604D",false)');
activeSheet.setFormula(3, 2, '=CASCADESPARKLINE(B2:B8,3,A2:A8,,,"#8CBF64","#D6604D",false)');
activeSheet.setFormula(4, 2, '=CASCADESPARKLINE(B2:B8,4,A2:A8,,,"#8CBF64","#D6604D",false)');
activeSheet.setFormula(5, 2, '=CASCADESPARKLINE(B2:B8,5,A2:A8,,,"#8CBF64","#D6604D",false)');
activeSheet.setFormula(6, 2, '=CASCADESPARKLINE(B2:B8,6,A2:A8,,,"#8CBF64","#D6604D",false)');
activeSheet.setFormula(7, 2, '=CASCADESPARKLINE(B2:B8,7,A2:A8,,,"#8CBF64","#D6604D",false)');
Use Case 2
The Cascade Sparkline can also be used to specifically depict how an initial value increases and decreases, leading to a final value. For this purpose, you can use the itemTypeRange parameter in the Cascade formula. The itemTypeRange parameter is useful in accounting and finance applications to show the net inflows and outflows that result in organizations.
CASCADESPARKLINE(pointsRange, pointIndex, labelsRange, minimum, maximum, colorPositive, colorNegative, vertical, itemTypeRange, colorTotal)
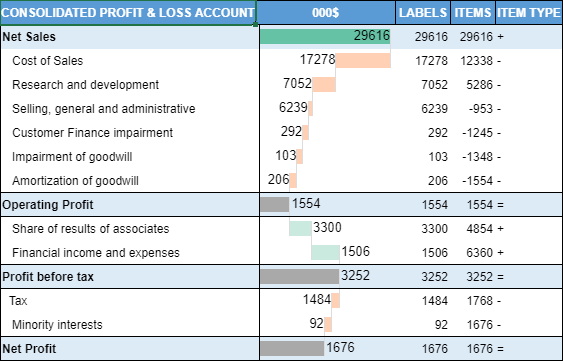
Refer to the following example, where the itemTypeRange parameter has been applied on the E2: E15 cell range of the worksheet in which the CASCADESPARKLINE formula is used to show the consolidated profit and loss scenario for the net sales in a company. The sparklines of 'Operating Profit', 'Profit before tax', and 'Net Profit' represent the total columns, and that's why these have their corresponding itemType as "=". The sparklines with positive and negative changes are represented using "+" and "-" itemType.

The following code sample creates a cascade sparkline using the formula in this use case.
// set text in cells
sheet.setText(0, 1, '000$');
sheet.setText(0, 2, 'LABELS');
sheet.setText(0, 3, 'ITEMS');
sheet.setText(0, 4, 'ITEM TYPE');

// create displayLabels array
var displayLabels = [
    'CONSOLIDATED PROFIT & LOSS ACCOUNT', 'Net Sales',
    '   Cost of Sales', '   Research and development', '   Selling, general and administrative', '   Customer Finance impairment',
    '   Impairment of goodwill', '   Amortization of goodwill', 'Operating Profit', '   Share of results of associates', '   Financial income and expenses',
    'Profit before tax', '  Tax', '   Minority interests', 'Net Profit'
];

// create items array
var items = [
    29616, 17278, 7052, 6239, 292, 103, 206, 1554, 3300, 1506, 3252, 1484, 92, 1676
];

// create labels array
var labels = [29616, 12338, 5286, -953, -1245, -1348, -1554, 1554, 4854, 6360, 3252, 1768, 1676, 1676
];

// create itemTypes array
var itemTypes = [
    '+', '-', '-', '-', '-', '-', '-', '=', '+', '+', '=', '-', '-', '='
];

// set arrays
sheet.setArray(0, 0, displayLabels);
sheet.setArray(1, 2, items);
sheet.setArray(1, 3, labels);
sheet.setArray(1, 4, itemTypes);

// set CASCADESPARKLINE formula
sheet.setFormula(1, 1, '=CASCADESPARKLINE(D2:D15, SEQUENCE(COUNTA(D2:D15),1,1,1),C2:C15,,,"#66C2A5","#FF7722",false,E2:E15,"#A9A9A9")'0);

