- SpreadJS Overview
- Getting Started
- JavaScript Frameworks
- Best Practices
-
Features
- Workbook
- Worksheet
- Rows and Columns
- Headers
- Cells
- Data Binding
- TableSheet
- GanttSheet
- JSON Schema with SpreadJS
- SpreadJS File Format
- Data Validation
- Conditional Formatting
- Sort
- Group
- Formulas
- Serialization
- Keyboard Actions
- Shapes
- Form Controls
- Floating Objects
- Barcodes
- Charts
- Sparklines
- Tables
- Pivot Table
- Slicer
- Theme
- Culture
- SpreadJS Designer
- SpreadJS Designer Component
- Touch Support
- Formula Reference
- Import and Export Reference
- Frequently Used Events
- API Documentation
- Release Notes
Add Hover Animation and Style
Usually, when a lot of data is plotted in a chart, data labels clutter the entire chart and make the view meaningless. SpreadJS provides support for adding hover animations and hover styles to enhance the user experience while interacting with charts.
Add Hover Animation
While working with SpreadJS, adding hover animation allows users to interact with the data points in the chart. This feature helps users to explore data and turn a basic chart into a responsive chart. Moreover, it enhances the readability of charts while making the spreadsheet more appealing for users.
Hover animations are useful, especially when:
Users are interested in knowing the exact values of the data points.
Users want to display additional information using mouse-over to derive valuable outcomes while analyzing charts.
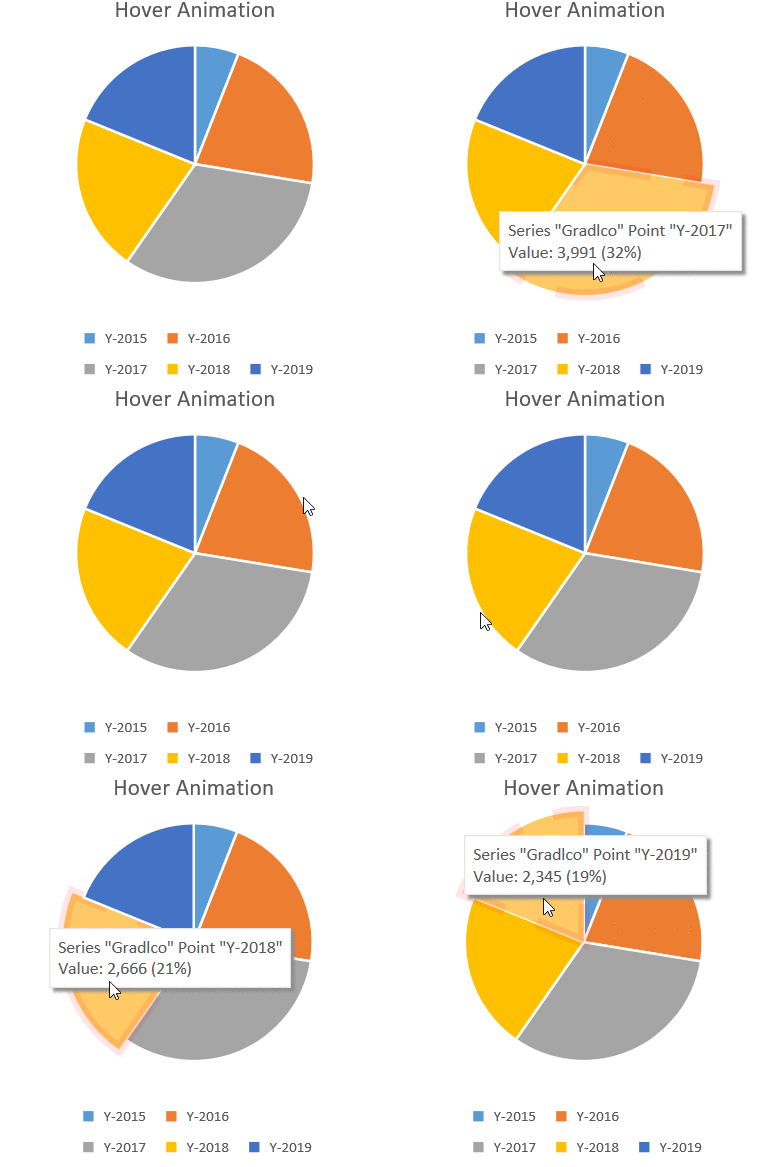
The following screenshot depicts a chart with hover animations. Users can use the mouse hover animation effect in the worksheet by simply moving the mouse pointer over the chart.

The useAnimation method can be used to add hover animation to charts. All chart types support hover animation except the StockHLC chart. After applying the hover animation effect, the data points in the chart enlarge and additional details about the plotted data points are displayed.
Apply Hover Style
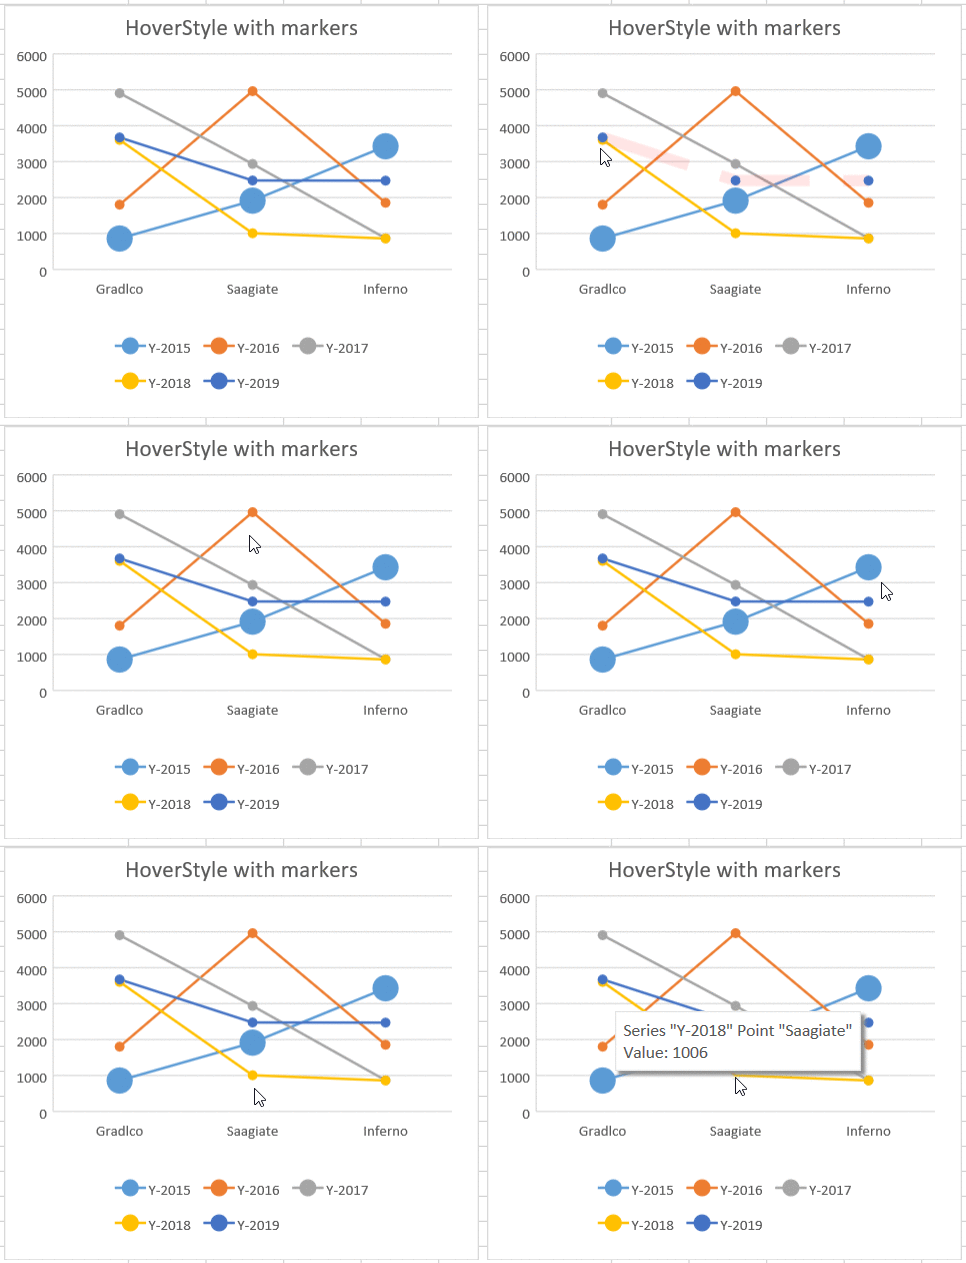
While working with SpreadJS, users can apply hover styles to charts by using the hoverStyle method. This feature allows users to highlight different data points in the chart. Moreover, it helps analysts to customize the appearance of the data that dynamically gets displayed when a user hovers over the data points in the chart.
All chart types support hover styles. Users can modify the color, transparency, line width, line color, line transparency, line type, symbol color, symbol transparency, symbol line width, symbol line color, symbol line transparency, and symbol line type while applying hover styles to the charts.
Note: The priority of hover style is higher than the style set for the data points.
The following screenshot depicts hover styles applied to a chart.

The following code sample shows how to add hover animations and hover styles to charts while visualizing data in spreadsheets.
var chart_columnClustered, chart_columnStacked, chart_columnStacked100, sheet;
window.onload = function () {
  var spread = new GC.Spread.Sheets.Workbook(document.getElementById("ss"));
  activeSheet = spread.getActiveSheet();
  activeSheet.suspendPaint();
  // Prepare data for the chart
  activeSheet.setValue(0, 1, "Y-2015");
  activeSheet.setValue(0, 2, "Y-2016");
  activeSheet.setValue(0, 3, "Y-2017");
  activeSheet.setValue(0, 4, "Y-2018");
  activeSheet.setValue(0, 5, "Y-2019");
  activeSheet.setValue(1, 0, "Gradlco");
  activeSheet.setValue(2, 0, "Saagiate");
  activeSheet.setValue(3, 0, "Inferno");
  activeSheet.setColumnWidth(0, 120);
  for (var r = 1; r <= 3; r++)
  {
    for (var c = 1; c <= 5; c++)
    {
      activeSheet.setValue(r, c, parseInt(Math.random() * 5000));
    }
  }
  // Configure Line Marker chart with HoverStyle
  var lineMarkerChart = activeSheet.charts.add('lineMarkerChart', GC.Spread.Sheets.Charts.ChartType.lineMarkers, 20, 100, 380, 330, "A1:F4", GC.Spread.Sheets.Charts.RowCol.columns);
  lineMarkerChart.title({ text: "HoverStyle with markers" });
  var seriesItem = lineMarkerChart.series().get(0);
  seriesItem.symbol.size = 20;
  lineMarkerChart.series().set(0, seriesItem);
  var hoverStyle = lineMarkerChart.hoverStyle();

  // Set applyHoverStyle to true
  hoverStyle.applyHoverStyle = true;
  hoverStyle.color = "orange";
  hoverStyle.transparency = 0.1;
  hoverStyle.borderStyle.transparency = 0.1;
  hoverStyle.borderStyle.color = '#FF0000';
  hoverStyle.borderStyle.width = 3;
  hoverStyle.borderStyle.dashStyle = GC.Spread.Sheets.Charts.LineType.lgDash;
  hoverStyle.symbolStyle.color = "yellow";
  hoverStyle.symbolStyle.transparency = 0.1;
  hoverStyle.symbolStyle.borderStyle.transparency = 0.1;
  hoverStyle.symbolStyle.borderStyle.color = 'rgb(0, 0, 255)';
  hoverStyle.symbolStyle.borderStyle.width = 9;
  hoverStyle.symbolStyle.borderStyle.dashStyle = GC.Spread.Sheets.Charts.LineType.lgDash;
  lineMarkerChart.hoverStyle(hoverStyle);
  // Configure Pie chart with Hover Animation
  var pieChart = activeSheet.charts.add('pieChart', GC.Spread.Sheets.Charts.ChartType.pie, 420, 100, 380, 330, 'A1:F4');
  pieChart.title({ text: "HoverStyle with Animation" });
  pieChart.useAnimation(true);
  var hoverStyle1 = pieChart.hoverStyle();

  // Set applyHoverStyle to true
  hoverStyle1.applyHoverStyle = true;
  hoverStyle1.color = "orange";
  hoverStyle1.transparency = 0.6;
  hoverStyle1.borderStyle.transparency = 0.1;
  hoverStyle1.borderStyle.color = '#FF0000';
  hoverStyle1.borderStyle.width = 9;
  hoverStyle1.borderStyle.dashStyle = GC.Spread.Sheets.Charts.LineType.lgDash;
  pieChart.hoverStyle(hoverStyle1);
  activeSheet.resumePaint();
};

