
- SpreadJS Overview
- Getting Started
- JavaScript Frameworks
- Best Practices
-
Features
- Workbook
- Worksheet
- Rows and Columns
- Headers
- Cells
- Data Binding
- TableSheet
- GanttSheet
- JSON Schema with SpreadJS
- SpreadJS File Format
- Data Validation
- Conditional Formatting
- Sort
- Group
- Formulas
- Serialization
- Keyboard Actions
- Shapes
- Form Controls
- Floating Objects
- Barcodes
- Charts
- Sparklines
- Tables
- Pivot Table
- Slicer
- Theme
- Culture
- SpreadJS Designer
- SpreadJS Designer Component
- Touch Support
- Formula Reference
- Import and Export Reference
- Frequently Used Events
- API Documentation
- Release Notes
Hidden Rows or Columns in Chart
SpeadJS allows users to control whether to show the data of hidden rows or columns in a chart or not. The ignoreHidden method, when set to true, does not display the data of hidden row or column in the chart. The same can also be achieved through SpreadJS designer by checking the ‘Show data in hidden rows and columns’ checkbox.
A row or column is considered hidden, if:
Its width is resized to 0
It is hidden
It is filtered out
Grouping is applied on it
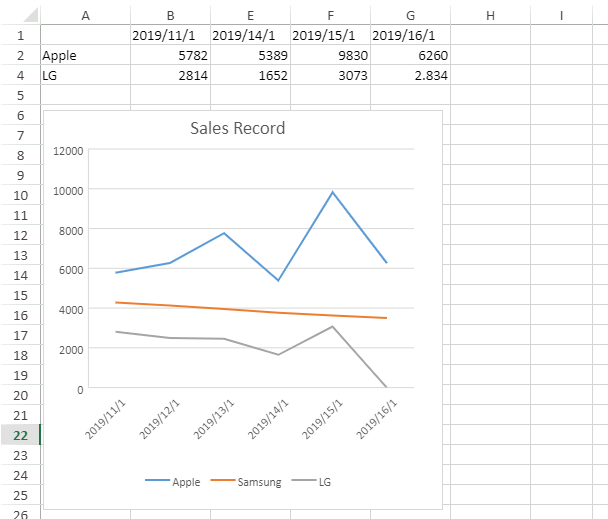
Example - The following image depicts a chart that displays the daily Sales Record of different company's smartphones. You may notice that the 3rd row and C and D columns are hidden in the spreadsheet. The visible data is for 4 dates of 2 companies (Apple and LG) whereas the chart depicts data for 6 dates of 3 companies (Samsung, as well). To display the data of hidden row and columns in chart, set the value of ignoreHidden method as false and your chart will be displayed as shown in the below screenshot.
The following code sample shows how to display the data of hidden rows or columns in the chart.
// create array
var dataArray = [
    ["", '2019/11/1', '2019/12/1', '2019/13/1', '2019/14/1', '2019/15/1', '2019/16/1'],
    ["Apple", 5782, 6263, 7766, 5389, 9830, 6260],
    ["Samsung", 4284, 4130, 3951, 3760, 3631, 3504],
    ["LG", 2814, 2491, 2455, 1652, 3073, 2.834]
];
// set columns width
activeSheet.setColumnWidth(0, 90.0, GC.Spread.Sheets.SheetArea.viewport);
for (var i = 1; i < 8; i++) {
    activeSheet.setColumnWidth(i, 80.0, GC.Spread.Sheets.SheetArea.viewport);
}
// set array
activeSheet.setArray(0, 0, dataArray);

// hide Row[1] & Column[3], Column[4]
activeSheet.setRowVisible(2, false, GC.Spread.Sheets.SheetArea.viewport);
activeSheet.setColumnVisible(2, false, GC.Spread.Sheets.SheetArea.viewport);
activeSheet.setColumnVisible(3, false, GC.Spread.Sheets.SheetArea.viewport);

// add chart
var chart = activeSheet.charts.add('LineChart', GC.Spread.Sheets.Charts.ChartType.line, 2, 85, 400, 400, 'A1:G4');
// set chart title
chart.title({ text: "Sales Record" });

// set ignoreHidden method to false in order to display the hidden rows and columns in the chart
chart.ignoreHidden(false);