
- SpreadJS Overview
- Getting Started
- JavaScript Frameworks
- Best Practices
-
Features
- Workbook
- Worksheet
- Rows and Columns
- Headers
- Cells
- Data Binding
- TableSheet
- GanttSheet
- JSON Schema with SpreadJS
- SpreadJS File Format
- Data Validation
- Conditional Formatting
- Sort
- Group
- Formulas
- Serialization
- Keyboard Actions
- Shapes
- Form Controls
- Floating Objects
- Barcodes
- Charts
- Sparklines
- Tables
- Pivot Table
- Slicer
- Theme
- Culture
- SpreadJS Designer
- SpreadJS Designer Component
- Touch Support
- Formula Reference
- Import and Export Reference
- Frequently Used Events
- API Documentation
- Release Notes
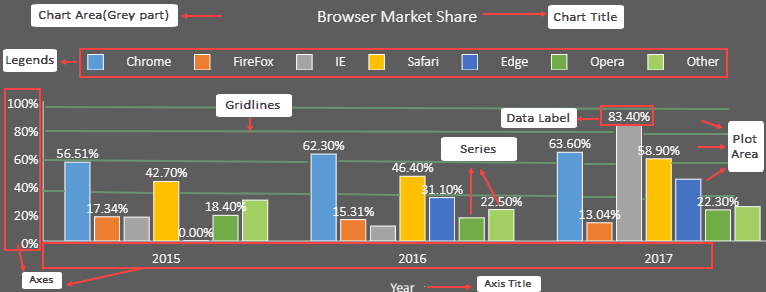
Chart Elements
In SpreadJS, a chart comprises several chart elements (chart area, chart title, plot area, series, axes, data labels, data markers, and legends) that can be formatted individually to generate 2-D charts with a customized layout.
Configuring chart elements in a spreadsheet not only enables users to represent information in a meaningful way but also helps them in putting together a clearer view of comparisons and trends for enhanced data visualization and analysis.
A basic chart with customized chart elements is shown below for your reference.
You can create and customize charts in the following ways: