
- SpreadJS Overview
- Getting Started
- JavaScript Frameworks
- Best Practices
-
Features
- Workbook
- Worksheet
- Rows and Columns
- Headers
- Cells
- Data Binding
- TableSheet
- GanttSheet
- JSON Schema with SpreadJS
- SpreadJS File Format
- Data Validation
- Conditional Formatting
- Sort
- Group
- Formulas
- Serialization
- Keyboard Actions
- Shapes
- Form Controls
- Floating Objects
- Barcodes
- Charts
- Sparklines
- Tables
- Pivot Table
- Slicer
- Theme
- Culture
- SpreadJS Designer
- SpreadJS Designer Component
- Touch Support
- Formula Reference
- Import and Export Reference
- Frequently Used Events
- API Documentation
- Release Notes
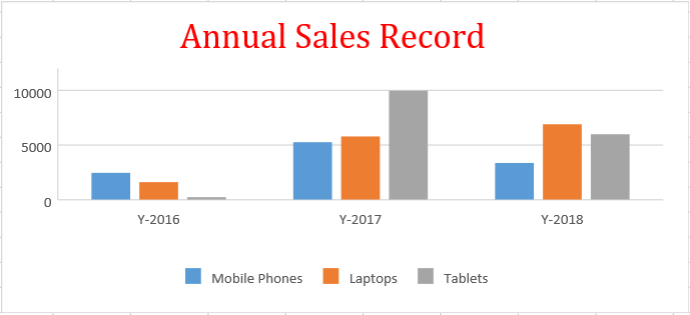
Chart Title
SpreadJS allows users to configure chart titles while visualizing data in the spreadsheets. The chart title refers to the name given to the chart.
Users can add a title to their chart by using the title method of the Chart class. Users can set a custom text for their chart; define its font family, change its font size and font color, etc. using the various customization options available in this method.
A chart with the customization of basic components is shown below. The title of this chart is "Annual Sales Record".
The following code sample shows how to configure a custom title for the chart.
var activeSheet = spread.getActiveSheet();
activeSheet.suspendPaint();
// Prepare data for chart
activeSheet.setValue(0, 1, "Y-2016");
activeSheet.setValue(0, 2, "Y-2017");
activeSheet.setValue(0, 3, "Y-2018");
activeSheet.setValue(1, 0, "Mobile Phones");
activeSheet.setValue(2, 0, "Laptops");
activeSheet.setValue(3, 0, "Tablets");
for (var r = 1; r <= 3; r++)
{
   for (var c = 1; c <= 3; c++) {
       activeSheet.setValue(r, c, parseInt(Math.random() * 10000));
    }
}
// Add chart
var chart = activeSheet.charts.add('Chart1', GC.Spread.Sheets.Charts.ChartType.columnClustered, 20, 110, 550, 250, "A1:D4");

// Configure chart title
var title = chart.title();
title.text = "Annual Sales Record";
title.fontFamily = "Cambria";
title.fontSize = 28;
title.color = "#696969";
chart.title(title);