
- SpreadJS Overview
- Getting Started
- JavaScript Frameworks
- Best Practices
-
Features
- Workbook
- Worksheet
- Rows and Columns
- Headers
- Cells
- Data Binding
- TableSheet
- GanttSheet
- JSON Schema with SpreadJS
- SpreadJS File Format
- Data Validation
- Conditional Formatting
- Sort
- Group
- Formulas
- Serialization
- Keyboard Actions
- Shapes
- Form Controls
- Floating Objects
- Barcodes
- Charts
- Sparklines
- Tables
- Pivot Table
- Slicer
- Theme
- Culture
- SpreadJS Designer
- SpreadJS Designer Component
- Touch Support
- Formula Reference
- Import and Export Reference
- Frequently Used Events
- API Documentation
- Release Notes
Pattern Fill in Charts
SpreadJS provides support for pattern fill in charts. The PatternType enumeration in SpreadJS API allows the users to apply different pattern styles in a chart in the worksheet. You can also specify the foreground and background color for it.
This feature helps the users to enhance the chart customization capabilities and add emphasis to the chart elements by applying pattern-fill. The following are the chart elements that support the pattern fill feature:
Datapoint
Chart area plot
Area data series
Chart title
Data labels
Legend
Header
Footer axis
Labels
Overlays
SpreadJS supports 48 built-in pattern styles. Refer to the following chart that uses pattern-fill to depict the world population.
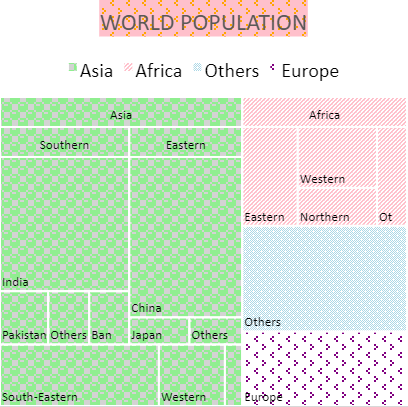
The following code sanple uses PatternType property to apply pattern fill to the chart elements.
$(document).ready(function () {
    // initializing Spread
    var spread = new GC.Spread.Sheets.Workbook(document.getElementById('ss'), { sheetCount: 1 });

    // Get the activesheet
    var sheet = spread.getSheet(0);

    // Set Column Width
    sheet.setColumnWidth(2, 100);
    sheet.setColumnWidth(4, 100);

    // Create Data Array
    var dataArray =
    [
        ['Region', 'Subregion', 'country', 'Population'],
        ['Asia', 'Southern', 'India', 1354051854],
        [, , 'Pakistan', 200813818],
        [, , 'Bangladesh', 166368149],
        [, , 'Others', 170220300],
        [, 'Eastern', 'China', 1415045928],
        [, , 'Japan', 127185332],
        [, , 'Others', 111652273],
        [, 'South-Eastern', , 655636576],
        [, 'Western', , 272298399],
        [, 'Central', , 71860465],
        ['Africa', 'Eastern', , 433643132],
        [, 'Western', , 381980688],
        [, 'Northern', , 237784677],
        [, 'Others', , 234512021],
        ['Europe', , , 742648010],
        ['Others', , , 1057117703]
    ];

    // Set Array
    sheet.setArray(1, 1, dataArray);
    var treemapChart = sheet.charts.add('chart1', GC.Spread.Sheets.Charts.ChartType.treemap, 450, 0, 500, 500, "B2:E18");

    // Get title and set it's backcolor with a pattern
    var title = treemapChart.title();
    title.fontSize = "24.00";
    title.text = "WORLD POPULATION";
    title.backColor = {
        type: GC.Spread.Sheets.Charts.PatternType.divot,
        foregroundColor: "Orange",
       backgroundColor: "pink",
    };
    treemapChart.title(title);

    // get dataPoints and set it's patternType
    var dataPoints = treemapChart.series().dataPoints();
    var fillColors = [{
            type: GC.Spread.Sheets.Charts.PatternType.sphere,
            foregroundColor: "LightGreen",
            backgroundColor: "lightgray",
        }, {
            type: GC.Spread.Sheets.Charts.PatternType.darkUpwardDiagonal,
            foregroundColor: "pink",
            backgroundColor: "white",
        },
        {
            type: GC.Spread.Sheets.Charts.PatternType.divot,
            foregroundColor: "purple",
            backgroundColor: "white",
        },
        {
            type: GC.Spread.Sheets.Charts.PatternType.dottedPercent40,
            foregroundColor: "LightBlue",
            backgroundColor: "white",
        }
    ];
    for (var i = 0; i < fillColors.length; i++) {
        var dataPoint = dataPoints.get(i);
        dataPoint.fillColor = fillColors[i];
        dataPoints.set(i, dataPoint);
    }

    // get datalabels and set it's backcolor to black
    var dataLabels = treemapChart.dataLabels();
    dataLabels.color = 'black';
    treemapChart.dataLabels(dataLabels);
});