- SpreadJS Overview
- Getting Started
- JavaScript Frameworks
- Best Practices
-
Features
- Workbook
- Worksheet
- Rows and Columns
- Headers
- Cells
- Data Binding
- TableSheet
- GanttSheet
- JSON Schema with SpreadJS
- SpreadJS File Format
- Data Validation
- Conditional Formatting
- Sort
- Group
- Formulas
- Serialization
- Keyboard Actions
- Shapes
- Form Controls
- Floating Objects
- Barcodes
- Charts
- Sparklines
- Tables
- Pivot Table
- Slicer
- Theme
- Culture
- SpreadJS Designer
- SpreadJS Designer Component
- Touch Support
- Formula Reference
- Import and Export Reference
- Frequently Used Events
- API Documentation
- Release Notes
Display N/A Cells in Chart
SpreadJS provides support to display #N/A cells as empty cells in charts. The displayNaNAsBlank property in SpreadJS API, when set to true, considers the cells containing #N/A values as empty cells.
When displayNaNAsBlank is set to true, the display of empty cells, when plotted on a chart depends on the value of the displayBlanksAs method. It can have three values:
Connected - #N/A values are shown as 'connected' in the chart
Gaps - #N/A values are shown as 'gaps' in the chart
Zero - #N/A values are shown as 'zero' in the chart
For more information on how empty cells are displayed in a chart, please refer to Display Empty Cells in Chart.
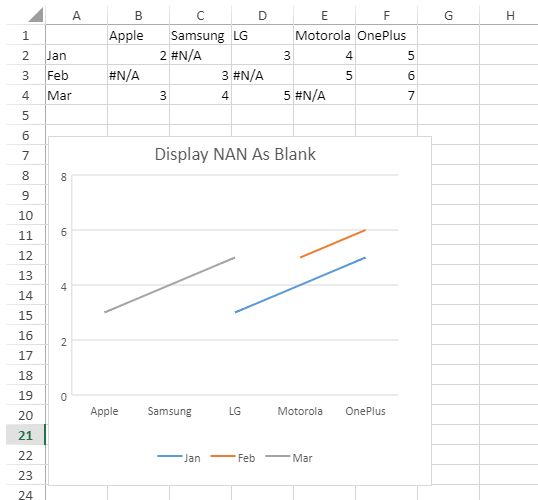
The below screenshot depicts a chart created from data containing #N/A cells which are displayed as gaps.
However, when displayNaNAsBlank is set to false, the #N/A values are displayed depending on the type of chart. For example:
Column, Pie, or Bar charts display #N/A values as gaps or zero
Scatter, Area or Stock charts display #N/A values as gaps
Line or Radar charts display #N/A values as connected
Note: Sunburst and Treemap charts don't allow #N/A cells within chart data.
The following code sample shows how to display #N/A cells as empty cells in the chart. The displayBlanksAs method shows empty cells as gaps.
// get the activesheet
var activeSheet = spread.getActiveSheet();
// create array
var na_error = GC.Spread.CalcEngine.Errors.NotAvailable;
var dataArray = [
    ["", "Apple", "Samsung", "LG", "Motorola", "OnePlus"],
    ["Jan", 2, na_error, 3, 4, 5],
    ["Feb", na_error, 3, na_error, 5, 6],
    ["Mar", 3, 4, 5, na_error, 7],
];
// set data
activeSheet.setArray(0, 0, dataArray);

// add chart
var chart = activeSheet.charts.add('Chart', GC.Spread.Sheets.Charts.ChartType.area, 2, 85, 350, 350, 'A1:F4');

// displayNaNAsBlank just make the #N/A treat as "blank"
chart.displayNaNAsBlank(true);
//then displayBlanksAs will tell chart how the "blank" displays i.e. zero/ gaps/ connected
chart.displayBlanksAs(GC.Spread.Sheets.Charts.DisplayBlanksAs.gaps);

// set chart title
chart.title({ text: "Display NAN As Blank" });


