
- SpreadJS Overview
- Getting Started
- JavaScript Frameworks
- Best Practices
-
Features
- Workbook
- Worksheet
- Rows and Columns
- Headers
- Cells
- Data Binding
- TableSheet
- GanttSheet
- JSON Schema with SpreadJS
- SpreadJS File Format
- Data Validation
- Conditional Formatting
- Sort
- Group
- Formulas
- Serialization
- Keyboard Actions
- Shapes
- Form Controls
- Floating Objects
- Barcodes
- Charts
- Sparklines
- Tables
- Pivot Table
- Slicer
- Theme
- Culture
- SpreadJS Designer
- SpreadJS Designer Component
- Touch Support
- Formula Reference
- Import and Export Reference
- Frequently Used Events
- API Documentation
- Release Notes
Data Labels
Data Labels identify the details of data points in a data series. They are used to ensure that users can easily understand and interpret the information plotted in a chart.
In SpreadJS, you can get or set the data labels, change their position and color, and control whether to show the data labels in the chart using the dataLabels method and DataLabelPosition enumeration.
A basic image with data label configuration is shown below.

The following code sample shows how to configure data labels in a chart.
//Configure DataLabels
var dataLabels = chart.dataLabels();
dataLabels.showValue = true;
dataLabels.showSeriesName = false;
dataLabels.showCategoryName = false;
dataLabels.color = "#000000";
var dataLabelPosition = GC.Spread.Sheets.Charts.DataLabelPosition;

// This position contains many options. Different chart type applies different position values
dataLabels.position = dataLabelPosition.outsideEnd;
chart.dataLabels(dataLabels);
You can also customize the style of data labels by setting the background color, transparency or border color, width, transparency, etc. Additionally, you can configure different styles for different series of a chart as can be observed in the below image.
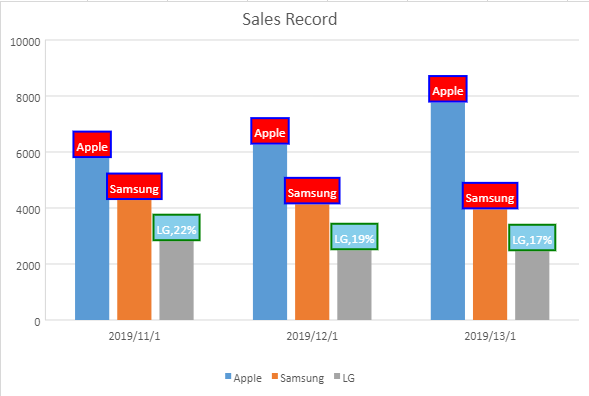
The following code sample shows how to configure styles of data labels for different chart series.
// get series 0 & 1 and set it's properties
for (var i = 0; i < 2; i++) {
    var series = chart.series().get(i);
    series.dataLabels = {
        showValue: false,
        showSeriesName: true,
        showCategoryName: false,
        showPercentage: false,
        separator: ",",
        position: GC.Spread.Sheets.Charts.DataLabelPosition.Center,
        format: "#,##0;-#,##0",
        color: "white",
        backColor: "red",
        borderColor: "blue",
        borderWidth: 2
    };
    chart.series().set(i, series);
}

// get series 2 and set it's properties
var series = chart.series().get(2);
series.dataLabels = {
    showValue: false,
    showSeriesName: true,
    showCategoryName: false,
    showPercentage: true,
    separator: ",",
    position: GC.Spread.Sheets.Charts.DataLabelPosition.Center,
    format: "#,##0;-#,##0",
    color: "white",
    backColor: "skyblue",
    borderColor: "green",
    borderWidth: 2
};
chart.series().set(2, series);