트리맵 차트
wijmo.chart.hierarchical.TreeMap 컨트롤을 사용하여 TreeMaps를 만듭니다. 이 주제에는 TreeMaps와 관련된 기능이 포함되어 있습니다. 데이터 레이블, 내보내기, 팔레트, 스타일 지정과 같은 일반적인 기능에 대해서는 차트 모듈 내의 다른 항목을 참조하실 수 있습니다.
Wijmo 트리 맵(TreeMap) 시작하기
JavaScript 어플리케이션에서 트리맵 컨트롤을 시작하는 단계는 다음과 같습니다:
Wijmo에 참조를 추가합니다.
Wijmo 컨트롤의 호스트 역할을 할 마크업을 추가합니다.
JavaScript를 통해 TreeMap 컨트롤을 초기화합니다.
HTML 예시:
<div id="myChart"></div>JavaScript 예시:
import * as hierarchical from '@mescius/wijmo.chart.hierarchical';

var myChart = new hierarchical.TreeMap('#myChart', {
    binding: 'sales',
    bindingName: ['category', 'subCategory'],
    itemsSource: getData(),
    dataLabel: {
        position: 'Center',
        content: '{name}'
    }
});
트리맵(TreeMap) 데이터 바인딩
TreeMap의 데이터 바인딩은 FlexChart와 약간 다르며, FlexPie와 더 유사합니다.
binding 속성은 다른 노드 값과 비교하여 노드의 크기를 계산하는 데 사용됩니다. 속성에는 숫자 데이터가 포함되어야 합니다.
bindingName 속성은 노드의 이름을 표시하는 데 사용됩니다. 배열 또는 문자열이어야 합니다.
그룹화된 데이터 소스 사용
그룹화된 CollectionView 데이터 소스와 함께 트리맵 차트를 사용할 수 있습니다. 예를 들어 CollectionView에 "category"와 "subCategory"라는 두 그룹 디스크립터(descriptors)가 있는 경우, __bindingName__에 대한 배열을 사용하여 TreeMap에 바인딩할 수 있습니다.
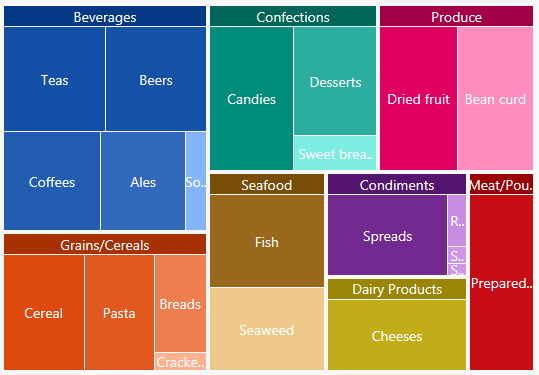
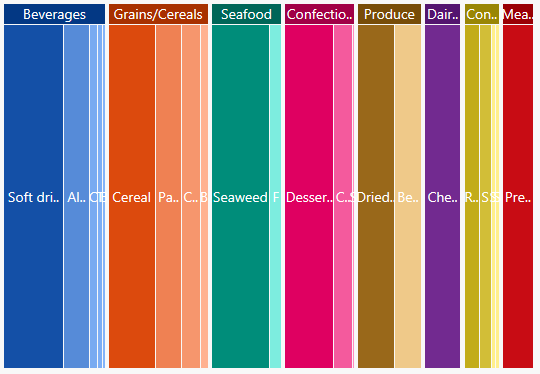
myChart.bindingName = ['category', 'subCategory'];가로 및 세로 트리맵(Horizontal and Vertical TreeMaps)
type 속성은 트리맵 컨트롤의 유형(Squarified, Horizontal 또는 Vertical)을 지정합니다.
예시:
import * as hierarchical from '@mescius/wijmo.chart.hierarchical';

var typeChart = new hierarchical.TreeMap('#typeChart', {
    binding: 'sales',
    bindingName: ['category', 'subCategory'],
    type: 'Vertical',
    itemsSource: getData(),
    dataLabel: {
        position: 'Center',
        content: '{name}'
    }
});
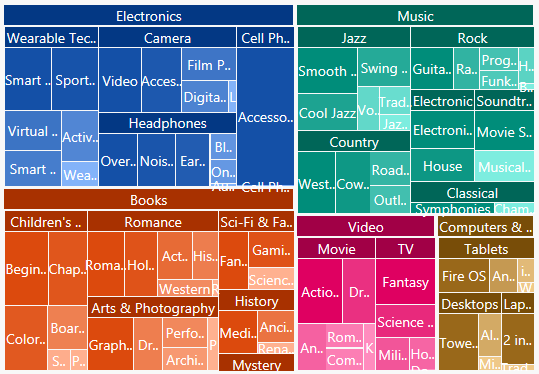
계층 트리 맵(Hierarchical TreeMaps)
childItemsPath 속성을 사용하여 계층 데이터에서 하위 항목을 생성하는 데 사용되는 속성(들)의 이름을 설정합니다. 다른 이름을 가진 다른 수준의 하위 항목인 경우, 이 속성을 각 수준에서 하위 항목을 포함하는 속성의 이름을 포함하는 배열로 설정합니다. (예: ['accounts', 'checks', 'earnings' ]).
maxDepth 속성은 현재 보기에 표시할 최대 노드 수준 수를 지정합니다. 아래 예에서 __maxDepth__는 '3'으로 설정되어 있으므로 트리맵은 처음 3 레벨만 시각화합니다(ie, Music > Country > Classic Country). 이 값을 '2'로 설정하면 트리맵은 두 레벨(즉, 음악 > 국가)만 시각화합니다.
계층 예시:
import * as hierarchical from '@mescius/wijmo.chart.hierarchical';

var myChart = new hierarchical.TreeMap('myChart', {
        binding: 'sales',
        bindingName: 'type',
        childItemsPath: 'items',
        maxDepth: 2,
        itemsSource: getHierarchicalData(),
        dataLabel: {
            position: 'Center',
            content: '{name}'
        }
});

function getHiearchicalData() {
    var data = [
        {
            type: 'Music', items: [
                {
                    type: 'Country', items: [
                        { type: 'Classic Country', sales: 50 },
                        { type: 'Cowboy Country', sales: 50 },
                        { type: 'Outlaw Country', sales: 50 }
                    ]
                },
                {
                    type: 'Rock', items: [
                        { type: 'Hard Rock', sales: 50 },
                        { type: 'Blues Rock', sales: 50 }
                    ]
                },
                {
                    type: 'Classical', items: [
                        { type: 'Symphonies', sales: 50 },
                        { type: 'Chamber Music', sales: 50 }
                    ]
                }
            ]
        },
        {
            type: 'Video', items: [
                {
                    type: 'Movie', items: [
                        { type: 'Comedy', sales: 50 },
                        { type: 'Drama', sales: 50 },
                        { type: 'Romance', sales: 50 }
                    ]
                },
                {
                    type: 'TV', items: [
                        { type: 'Science Fiction', sales: 50 },
                        { type: 'Documentary', sales: 50 },
                        { type: 'Fantasy', sales: 50 },
                        { type: 'Horror', sales: 50 }
                    ]
                }
            ]
        }
    ];
    return data;
}
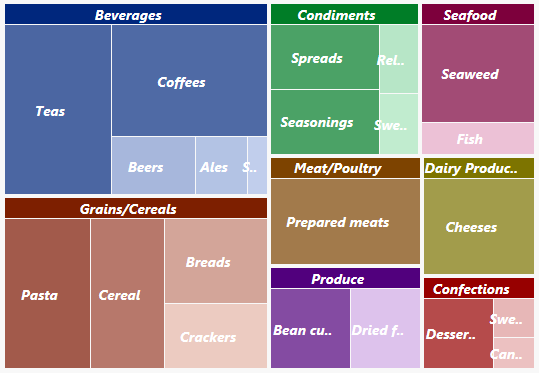
트리맵(TreeMap) 색상 팔레트
palette 속성은 차트에 사용되는 색상을 결정합니다. 배열에는 CSS 색상을 나타내는 문자열이 포함되어 있습니다. 예시:
// use colors specified by name
myChart.palette = ['red', 'green', 'blue'];

// or use colors specified as rgba-values
myChart.palette = [
  'rgba(255,0,0,1)',
  'rgba(255,0,0,0.8)',
  'rgba(255,0,0,0.6)',
  'rgba(255,0,0,0.4)'];
트리맵 컨트롤은 각 그룹의 색상 범위를 지원합니다. 이를 통해 각 그룹이 하나의 색상 그룹에 대한 테마를 유지할 수 있습니다.
myChart.palette = [
    { titleColor: '#00277d', maxColor: 'rgba(0,39,125,0.7)', minColor: 'rgba(168,187,230,0.7)' },
    { titleColor: '#7d1f00', maxColor: 'rgba(125,21,0,0.7)', minColor: 'rgba(230,183,168,0.7)' },
    { titleColor: '#007d27', maxColor: 'rgba(0,125,39,0.7)', minColor: 'rgba(168,230,188,0.7)' },
    { titleColor: '#7d003c', maxColor: 'rgba(125,0,60,0.7)', minColor: 'rgba(230,168,198,0.7)' },
    { titleColor: '#7d4300', maxColor: 'rgba(125,67,0,0.7)', minColor: 'rgba(230,201,168,0.7)' },
    { titleColor: '#51007d', maxColor: 'rgba(81,0,125,0.7)', minColor: 'rgba(209,170,230,0.7)' },
    { titleColor: '#7d7400', maxColor: 'rgba(125,116,0,0.7)', minColor: 'rgba(230,226,168,0.7)' },
    { titleColor: '#970000', maxColor: 'rgba(151,0,0,0.7)', minColor: 'rgba(230,169,169,0.7)' }
    ]