- SpreadJS Overview
- Getting Started
- JavaScript Frameworks
- Best Practices
-
Features
- Workbook
- Worksheet
- Rows and Columns
- Headers
-
Cells
- Work with Cells
- Cell Types
- Cell Format
- Cell States
- Cell Range
- Get Dirty Status
- Cell Buttons
- Cell Dropdowns
- Cell Comments
- Hyperlink
- Auto Merge Cells
- AutoFit
- Auto Fill Data
- Mask Input
- Shrink to Fit
- Cell Overflow
- Ellipsis or Tips for Cell Overflow
- Cell Alignment and Indentation
- Cell Padding and Label Styles
- Cell Span
- Cell Tags
- Styles
- Cell Decoration
- Cell Colors
- Borders, Gridlines and Diagonal Lines
- Quote Prefix
- Insert Cut or Copied Cells
- Rotate Text In Cells
- Vertical Text Direction
- Text Decoration
- Rich Text
- Wrap Text
- Drag and Drop
- Drag and Merge
- Edit Mode Always
- Watermark
- Display Zero as Blank
- IME Mode
- Pattern Fill and Gradient Fill
- Paste Options
- Data Binding
- TableSheet
- GanttSheet
- JSON Schema with SpreadJS
- SpreadJS File Format
- Data Validation
- Conditional Formatting
- Sort
- Group
- Formulas
- Serialization
- Keyboard Actions
- Shapes
- Form Controls
- Floating Objects
- Barcodes
- Charts
- Sparklines
- Tables
- Pivot Table
- Slicer
- Theme
- Culture
- SpreadJS Designer
- SpreadJS Designer Component
- Touch Support
- Formula Reference
- Import and Export Reference
- Frequently Used Events
- API Documentation
- Release Notes
Range Template Cell
SpreadJS provides support for creating a range cell type that allows users to specify a cell range in the worksheet as a template.
Usage Scenario
Range cell type is a very powerful feature that enables users and developers to define a template of cell ranges as a single cell type and apply that template to a cell to load different types of data into the template (including multiple rows and/or columns). Once the cell type is applied to a cell or a cell range, then the range template will use the cell value (or values) as a data source to resolve the binding path of the specified range.
Using range templates is beneficial, especially in the following scenarios:
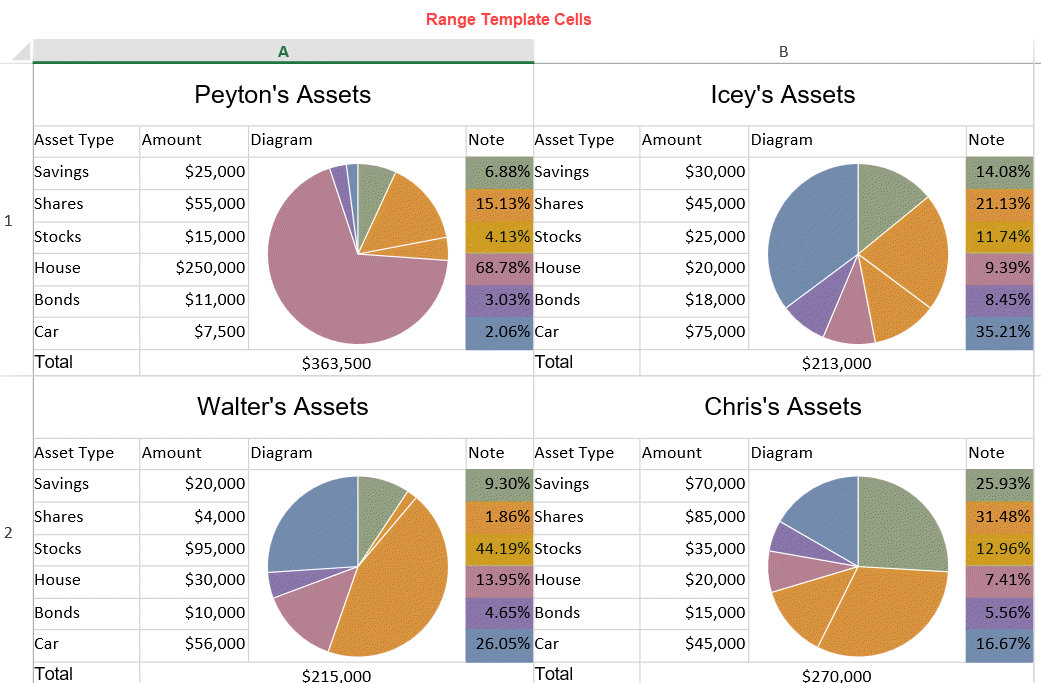
When users want to display some specific ranges of data with identical structures easily and quickly (as shown in the screenshot shared below) without having to configure the same style for each and every range one by one.

When users want to use range cell type to create custom sparklines, as shown in the example of the data analytics report shared below:

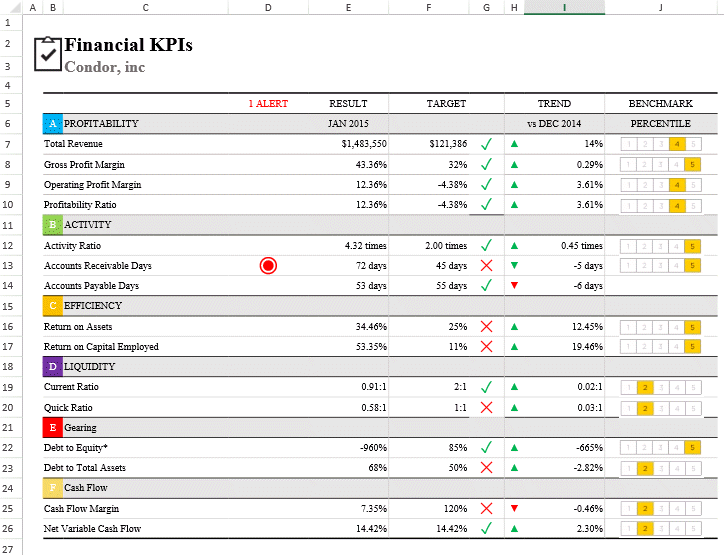
When users want to use range template cell type to create KPI blocks (for example - financial KPI) as shown in the below screenshot
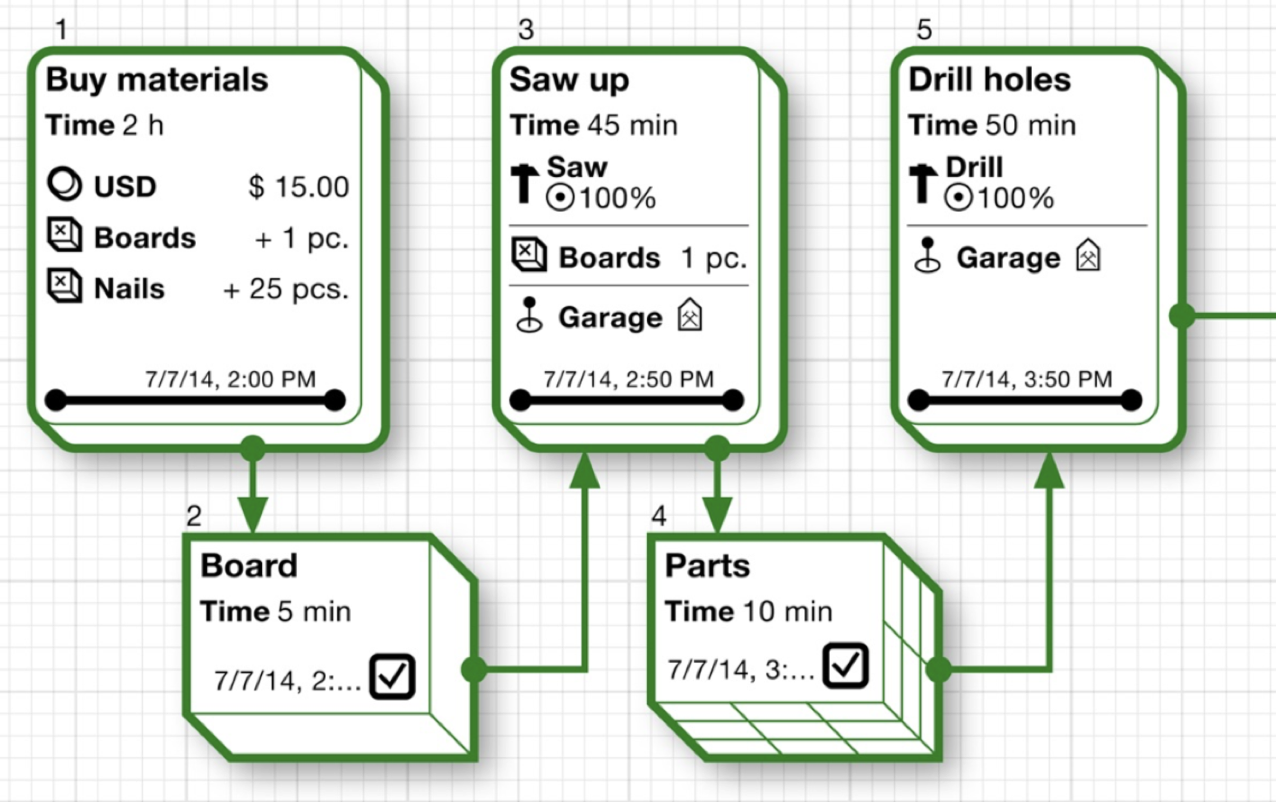
When users want to define a range template and use it as a shape as shown in the image shared below. This will insert a shape that renders as a template based on the specific task, which can help users to create a work-based schedule for project management while working with spreadsheets.
When users want to combine array functions to create a dashboard block that shows top product sales in a specific region. For example - the template can be created in such a way that it takes the region parameter and then uses array functions to filter out a dataset and show top product sales captured by the range template.
How Range Templates Work
Creating range cell types and configuring range templates in spreadsheets allows users to modify the display mode of the batch fragments and tweak their appearance simply by changing the template.
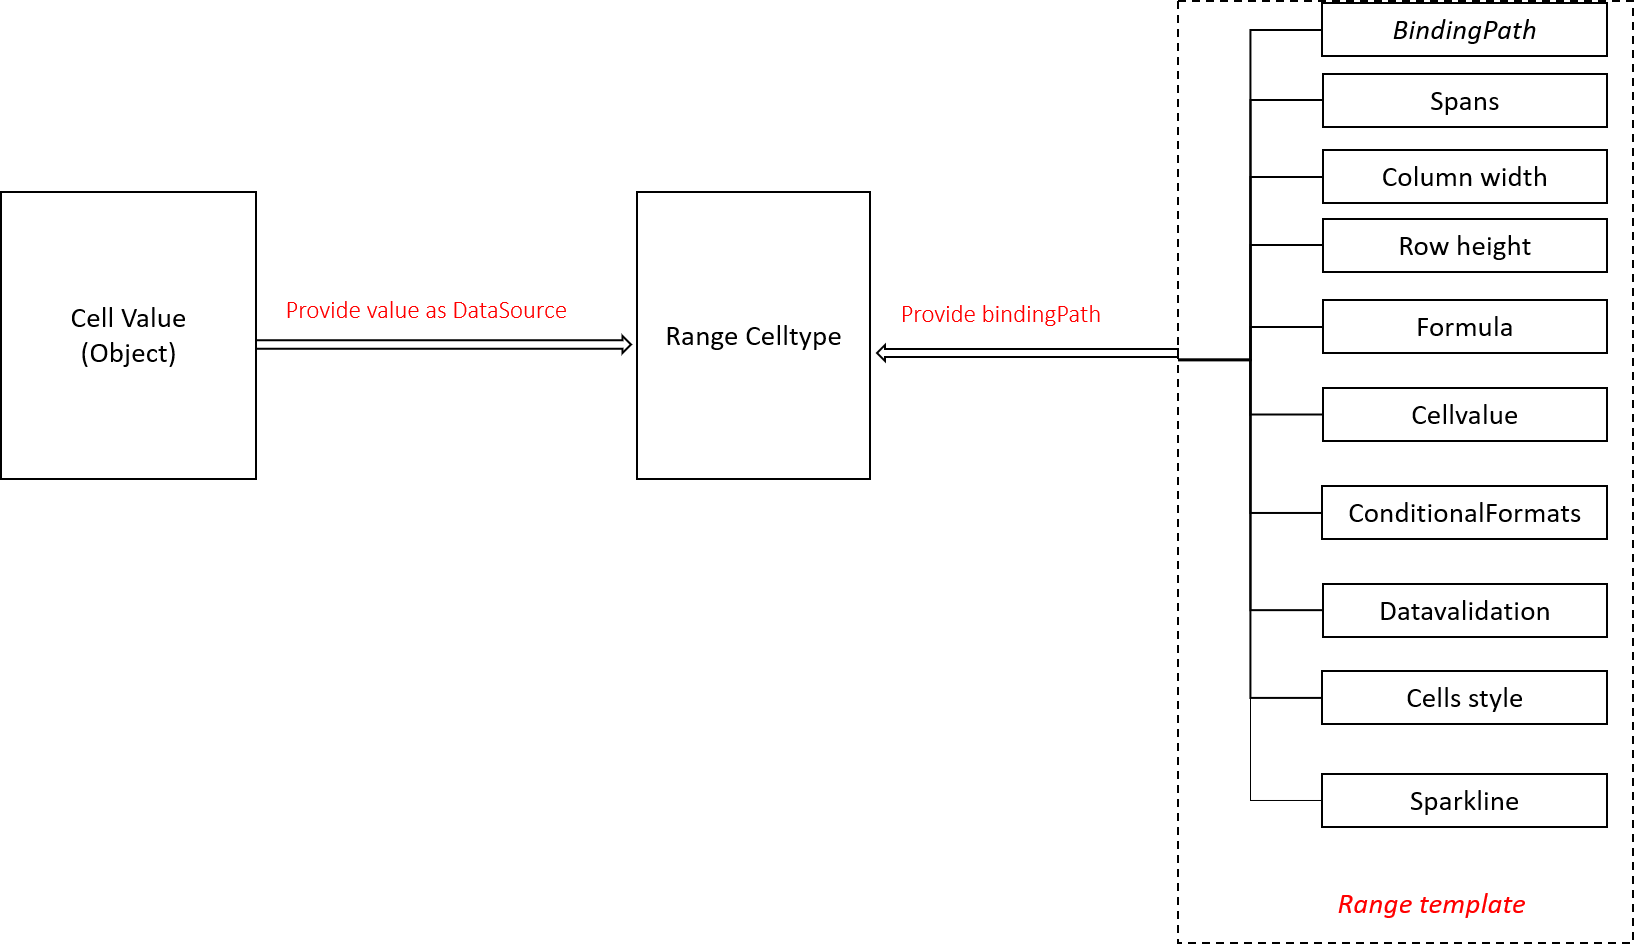
A range-cell type can be set as a normal cell type (using GC.Spread.Sheets.Style). Users need to create an instance of a range cell type and this object can be used for resolving the data binding path and providing the range layout & cell style information for every cell in the specified range.
The following images depict the workflow for a range cell type in a spreadsheet:
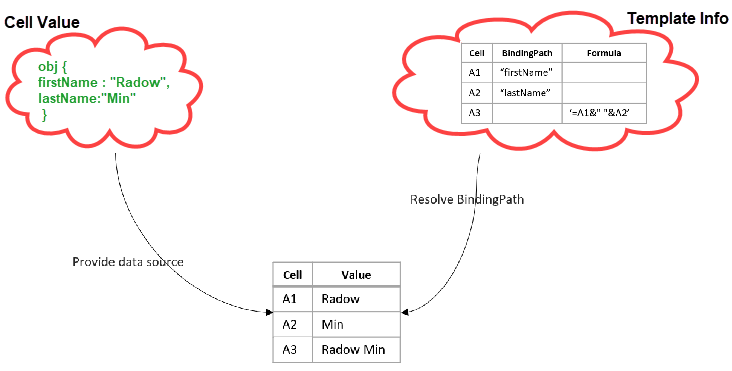
The following steps must be performed for creating a range template cell type in the worksheet:
Create a Template - A template can be created by designing a range in the worksheet. To bind data to the template, you can use the setBindingPath method.
Configure Data - Next, users need to configure a DataSource in the worksheet to be bound to the template.
Create & Apply Range Template Celltype - Now, create a RangeTemplate celltype using a range of cells from TemplateSheet and apply this RangeTemplate celltype in RenderSheet. RangeTemplate celltype can be set using the cellType method of the CellRange class. Here, a range template celltype is created by resolving the binding path to include the template information (provided in Step 1) and then using the data source (provided in Step 2) to configure the celltype in a range.
Using Code
Refer to the following example code for creating and adding range template cell type in the worksheet.
// Initializing Spread
var spread = new GC.Spread.Sheets.Workbook(document.getElementById('ss'), { sheetCount: 1 });
// Get the activesheet as renderSheet
var renderSheet = spread.getActiveSheet();

// Step 1. Create a new Worksheet as templateSheet
var templateSheet = new GC.Spread.Sheets.Worksheet();

// This templateSheet is used to create a template for RangeTemplate CellType
templateSheet.suspendPaint();
templateSheet.addSpan(0, 0, 1, 4);
templateSheet.getCell(0, 0).font("20px Arial").hAlign(GC.Spread.Sheets.HorizontalAlign.center).vAlign(GC.Spread.Sheets.VerticalAlign.center);
templateSheet.setBindingPath(0, 0, "name");
templateSheet.setValue(1, 0, "Asset Type");
templateSheet.setValue(1, 1, "Amount");
templateSheet.setValue(1, 2, "Diagram");
templateSheet.setValue(1, 3, "Note");
templateSheet.setValue(2, 0, "Savings");
templateSheet.setBindingPath(2, 1, "savings");
templateSheet.setValue(3, 0, "Shares");
templateSheet.setBindingPath(3, 1, "shares");
templateSheet.setValue(4, 0, "Stocks");
templateSheet.setBindingPath(4, 1, "stocks");
templateSheet.setValue(5, 0, "House");
templateSheet.setBindingPath(5, 1, "house");
templateSheet.setValue(6, 0, "Bonds");
templateSheet.setBindingPath(6, 1, "bonds");
templateSheet.setValue(7, 0, "Car");
templateSheet.setBindingPath(7, 1, "car");
templateSheet.setFormatter(-1, 1, "$#,##0");
templateSheet.addSpan(2, 2, 6, 1);
templateSheet.addSpan(8, 1, 1, 3);
templateSheet.setValue(8, 0, "Total");
templateSheet.getCell(8, 0).font("14px Arial");
templateSheet.setFormula(8, 1, "=SUM(B3:B8)");
templateSheet.getCell(8, 1).hAlign(GC.Spread.Sheets.HorizontalAlign.center);
templateSheet.setFormula(2, 2, '=PIESPARKLINE(B3:B8,"#919F81","#D7913E","CEA722","#B58091","#8974A9","#728BAD")');
templateSheet.getCell(2, 3).backColor("#919F81").formula("=B3/$B$9");
templateSheet.getCell(3, 3).backColor("#D7913E").formula("=B4/$B$9");
templateSheet.getCell(4, 3).backColor("#CEA722").formula("=B5/$B$9");
templateSheet.getCell(5, 3).backColor("#B58091").formula("=B6/$B$9");
templateSheet.getCell(6, 3).backColor("#8974A9").formula("=B7/$B$9");
templateSheet.getCell(7, 3).backColor("#728BAD").formula("=B8/$B$9");
templateSheet.setFormatter(-1, 3, "0.00%");
templateSheet.setRowHeight(0, 50);

for (var i = 1; i < 8; i++) {
     templateSheet.setRowHeight(i, 25);
}

templateSheet.setColumnWidth(0, 100);
templateSheet.setColumnWidth(1, 100);
templateSheet.setColumnWidth(2, 200);
templateSheet.resumePaint();

// Step 2. Configure & Add Data to renderSheet
// Configure Data
var data = [{
        "name": "Peyton's Assets",
        "savings": 25000,
        "shares": 55000,
        "stocks": 15000,
        "house": 250000,
        "bonds": 11000,
        "car": 7500
    }, {
        "name": "Icey's Assets",
        "savings": 30000,
        "shares": 45000,
        "stocks": 25000,
        "house": 20000,
        "bonds": 18000,
        "car": 75000
    }, {
        "name": "Walter's Assets",
        "savings": 20000,
        "shares": 4000,
        "stocks": 95000,
        "house": 30000,
        "bonds": 10000,
        "car": 56000
    }, {
        "name": "Chris's Assets",
        "savings": 70000,
        "shares": 85000,
        "stocks": 35000,
        "house": 20000,
        "bonds": 15000,
        "car": 45000
}];

// Add Data to renderSheet
renderSheet.setValue(0, 0, data[0]);
renderSheet.setValue(0, 1, data[1]);
renderSheet.setValue(1, 0, data[2]);
renderSheet.setValue(1, 1, data[3]);

// Step 3. Create RangeTemplate CellType using range of cells[0,0,9,4] from templateSheet
var rangeTemplateCelltype = new GC.Spread.Sheets.CellTypes.RangeTemplate(templateSheet, 0, 0, 9, 4);

// Apply RangeTemplate CellType to a range of cells in renderSheet
renderSheet.getRange(0, 0, 2, 2).cellType(rangeTemplateCelltype);
renderSheet.setColumnWidth(0, 400);
renderSheet.setRowHeight(0, 250);
renderSheet.setColumnWidth(1, 400);
renderSheet.setRowHeight(1, 250);
renderSheet.resumePaint();

